Understanding Proportional Relationships
Interactive Video
•
Mathematics
•
6th - 7th Grade
•
Practice Problem
•
Hard

Thomas White
FREE Resource
Read more
10 questions
Show all answers
1.
MULTIPLE CHOICE QUESTION
30 sec • 1 pt
What is the main focus of Lesson 3 in the video?
Studying geometric shapes
Learning about quadratic functions
Exploring proportional relationships
Understanding linear equations
2.
MULTIPLE CHOICE QUESTION
30 sec • 1 pt
In the example with Jada and Noah, how many steps does Jada take when Noah takes 10 steps?
8 steps
12 steps
10 steps
15 steps
3.
MULTIPLE CHOICE QUESTION
30 sec • 1 pt
What does the variable 'X' represent in the equation y = 54s x?
The number of steps Noah takes
The time taken to walk
The number of steps Jada takes
The total distance walked
4.
MULTIPLE CHOICE QUESTION
30 sec • 1 pt
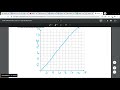
What is a key characteristic of a proportional relationship on a graph?
It is a horizontal line
It has a negative slope
It passes through the origin
It forms a parabola
5.
MULTIPLE CHOICE QUESTION
30 sec • 1 pt
How can you determine the constant of proportionality from a table?
By multiplying the X and Y values
By adding the X and Y values
By subtracting X from Y
By dividing Y by X
6.
MULTIPLE CHOICE QUESTION
30 sec • 1 pt
What is the significance of the constant of proportionality in a proportional relationship?
It shows the maximum value
It indicates the y-intercept
It determines the slope of the line
It represents the midpoint
7.
MULTIPLE CHOICE QUESTION
30 sec • 1 pt
Why is it important for all representations (equation, table, graph) to have the same constant of proportionality?
To simplify the equation
To confirm they represent the same proportional relationship
To ensure they represent different situations
To make the graph more complex
Access all questions and much more by creating a free account
Create resources
Host any resource
Get auto-graded reports
Continue with Google

Continue with Email
Continue with Classlink
Continue with Clever
or continue with
Microsoft
%20(1).png)
Apple
Others
Already have an account?
