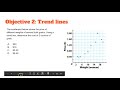
Statistical Concepts and Trend Analysis
Interactive Video
•
Mathematics, Science, Computers
•
9th - 10th Grade
•
Practice Problem
•
Hard

Thomas White
FREE Resource
Read more
10 questions
Show all answers
1.
MULTIPLE CHOICE QUESTION
30 sec • 1 pt
What is the main focus of the video tutorial?
Data collection methods
Statistical software usage
Associations in data
Data visualization techniques
2.
MULTIPLE CHOICE QUESTION
30 sec • 1 pt
Which type of correlation is indicated by data points that form a curve?
Positive linear correlation
No correlation
Negative linear correlation
Nonlinear correlation
3.
MULTIPLE CHOICE QUESTION
30 sec • 1 pt
What is an outlier in a data set?
A point that follows the trend
A point that forms a perfect line
A group of points clustered together
A point that is extremely high or low and does not follow the trend
4.
MULTIPLE CHOICE QUESTION
30 sec • 1 pt
What tool is recommended for drawing a straight trend line on a computer?
Pen tool
Eraser tool
Shapes tool
Brush tool
5.
MULTIPLE CHOICE QUESTION
30 sec • 1 pt
In the example provided, what was the estimated cost of two ounces of grain?
$20
30 cents
$16
40 cents
6.
MULTIPLE CHOICE QUESTION
30 sec • 1 pt
What is another term for a trend line?
Scatter plot
Correlation line
Data curve
Line of best fit
7.
MULTIPLE CHOICE QUESTION
30 sec • 1 pt
Which of the following is NOT a characteristic of a good trend line?
It alternates between passing above and below points
It lies completely above or below all points
It approximates the data points
It passes through the middle of the data points
Access all questions and much more by creating a free account
Create resources
Host any resource
Get auto-graded reports
Continue with Google

Continue with Email
Continue with Microsoft
or continue with

%20(1).png)
Apple
Others
Already have an account?
