Phytoplankton Growth and Algal Blooms
Interactive Video
•
Biology
•
9th - 10th Grade
•
Practice Problem
•
Hard

Patricia Brown
FREE Resource
Read more
10 questions
Show all answers
1.
MULTIPLE CHOICE QUESTION
30 sec • 1 pt
What is the primary focus of Michelle Woods' research?
Coral reef conservation
Marine biodiversity
Ocean acidification
Harmful algal blooms
2.
MULTIPLE CHOICE QUESTION
30 sec • 1 pt
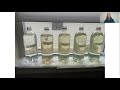
What are the three types of water samples used in the experiment?
Saltwater, freshwater, and distilled water
Purified water, algae water, and algae with fertilizer
Tap water, rainwater, and seawater
Mineral water, spring water, and river water
3.
MULTIPLE CHOICE QUESTION
30 sec • 1 pt
How do students track phytoplankton growth in the experiment?
By taking daily pictures of the bottles
By recording the pH level of the water
By counting the number of fish
By measuring water temperature
4.
MULTIPLE CHOICE QUESTION
30 sec • 1 pt
What do color changes and bubbles in the bottles indicate?
Increase in water temperature
Decrease in water quality
Phytoplankton growth
Presence of harmful bacteria
5.
MULTIPLE CHOICE QUESTION
30 sec • 1 pt
What is the purpose of extending the experiment by five days?
To allow more time for data analysis
To ensure students have enough time to complete their reports
To test different types of fertilizers
To observe adequate phytoplankton growth
6.
MULTIPLE CHOICE QUESTION
30 sec • 1 pt
How do students convert qualitative data into quantitative data?
By performing a chemical test
By conducting a survey
By using a graph and table
By using a microscope
7.
MULTIPLE CHOICE QUESTION
30 sec • 1 pt
What does a lack of color or bubbles in the purified water bottle indicate?
Presence of algae
Contaminated water
No phytoplankton present
High phytoplankton abundance
Access all questions and much more by creating a free account
Create resources
Host any resource
Get auto-graded reports
Continue with Google

Continue with Email
Continue with Classlink
Continue with Clever
or continue with
Microsoft
%20(1).png)
Apple
Others
Already have an account?
