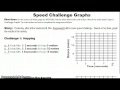
Distance-Time Graphs and Activities
Interactive Video
•
Mathematics
•
4th - 5th Grade
•
Practice Problem
•
Hard

Patricia Brown
FREE Resource
Read more
10 questions
Show all answers
1.
MULTIPLE CHOICE QUESTION
30 sec • 1 pt
What activity did the students perform during the speed challenge?
Skipping
Cycling
Hopping
Swimming
2.
MULTIPLE CHOICE QUESTION
30 sec • 1 pt
What is plotted on the Y-axis of a distance-time graph?
Distance
Speed
Acceleration
Time
3.
MULTIPLE CHOICE QUESTION
30 sec • 1 pt
What unit is used for distance on the graph?
Kilometers
Miles
Meters
Centimeters
4.
MULTIPLE CHOICE QUESTION
30 sec • 1 pt
How many seconds did it take Mrs. B to hop 5 meters?
8 seconds
2 seconds
3 seconds
5 seconds
5.
MULTIPLE CHOICE QUESTION
30 sec • 1 pt
What tool is recommended for drawing straight lines on the graph?
Pencil
Ruler
Protractor
Compass
6.
MULTIPLE CHOICE QUESTION
30 sec • 1 pt
How many seconds did it take Mrs. B to hop 10 meters?
5 seconds
8 seconds
2 seconds
10 seconds
7.
MULTIPLE CHOICE QUESTION
30 sec • 1 pt
At what time did Mrs. B reach 15 meters?
10 seconds
12 seconds
5 seconds
8 seconds
Access all questions and much more by creating a free account
Create resources
Host any resource
Get auto-graded reports
Continue with Google

Continue with Email
Continue with Classlink
Continue with Clever
or continue with
Microsoft
%20(1).png)
Apple
Others
Already have an account?
