Understanding Sankey Diagrams
Interactive Video
•
Physics
•
9th - 10th Grade
•
Practice Problem
•
Hard

Patricia Brown
FREE Resource
Read more
10 questions
Show all answers
1.
MULTIPLE CHOICE QUESTION
30 sec • 1 pt
What is the primary purpose of a Sankey diagram?
To calculate the speed of a vehicle
To measure the temperature of a system
To show the flow of energy within a system
To determine the color of an object
2.
MULTIPLE CHOICE QUESTION
30 sec • 1 pt
What is the first step in drawing a Sankey diagram?
Drawing arrows for energy flow
Deciding how much energy each grid square represents
Labeling the type of energy
Calculating the efficiency
3.
MULTIPLE CHOICE QUESTION
30 sec • 1 pt
How is the useful energy represented in a Sankey diagram?
By a vertical line
By a horizontal arrow pointing right
By a circle
By a diagonal line
4.
MULTIPLE CHOICE QUESTION
30 sec • 1 pt
In the car example, what type of energy is considered useful?
Chemical energy
Potential energy
Kinetic energy
Thermal energy
5.
MULTIPLE CHOICE QUESTION
30 sec • 1 pt
What does a curving arrow in a Sankey diagram typically represent?
Useful energy
Potential energy
Lost energy
Total energy
6.
MULTIPLE CHOICE QUESTION
30 sec • 1 pt
In a complex scenario like a coal power plant, what does the Sankey diagram help illustrate?
The temperature of water
The proportion of energy lost at each stage
The speed of turbines
The color of coal
7.
MULTIPLE CHOICE QUESTION
30 sec • 1 pt
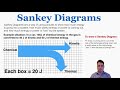
How many boxes high is the rectangle for 160 Joules in a Sankey diagram if each box represents 20 Joules?
4 boxes
6 boxes
10 boxes
8 boxes
Access all questions and much more by creating a free account
Create resources
Host any resource
Get auto-graded reports
Continue with Google

Continue with Email
Continue with Classlink
Continue with Clever
or continue with
Microsoft
%20(1).png)
Apple
Others
Already have an account?
Popular Resources on Wayground

8 questions
Spartan Way - Classroom Responsible
Quiz
•
9th - 12th Grade
15 questions
Fractions on a Number Line
Quiz
•
3rd Grade
14 questions
Boundaries & Healthy Relationships
Lesson
•
6th - 8th Grade
20 questions
Equivalent Fractions
Quiz
•
3rd Grade
3 questions
Integrity and Your Health
Lesson
•
6th - 8th Grade
25 questions
Multiplication Facts
Quiz
•
5th Grade
9 questions
FOREST Perception
Lesson
•
KG
20 questions
Main Idea and Details
Quiz
•
5th Grade
Discover more resources for Physics
10 questions
Exit Check 4.5 - Impulse
Quiz
•
9th Grade
20 questions
Simple Machines and Mechanical Advantage Quiz
Quiz
•
9th Grade
20 questions
Electricity/Magnets
Quiz
•
9th Grade
20 questions
Light Vs. Sound Waves
Quiz
•
9th - 12th Grade
14 questions
Bill Nye Waves
Interactive video
•
9th - 12th Grade
37 questions
CIA #3 Study Guide: ACPS
Quiz
•
10th Grade
20 questions
Waves
Quiz
•
9th - 12th Grade
10 questions
Exploring the Properties of Waves
Interactive video
•
9th - 12th Grade