Climate and Weather Concepts Assessment
Interactive Video
•
Geography
•
6th - 7th Grade
•
Practice Problem
•
Hard

Patricia Brown
FREE Resource
Read more
10 questions
Show all answers
1.
MULTIPLE CHOICE QUESTION
30 sec • 1 pt
What is the definition of climate?
The measure of how hot or cold the atmosphere is.
The average expected weather conditions of an atmosphere in a place.
The daily weather conditions of a specific location.
Rain, sleet, hail, or snow that falls to the ground.
2.
MULTIPLE CHOICE QUESTION
30 sec • 1 pt
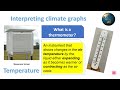
What is the purpose of a Stevenson screen?
To measure wind speed.
To house thermometers for accurate temperature readings.
To collect rainfall data.
To display climate graphs.
3.
MULTIPLE CHOICE QUESTION
30 sec • 1 pt
How does a thermometer work?
By measuring the speed of wind.
By capturing the amount of rainfall.
By showing the change in air temperature through liquid expansion or contraction.
By displaying the average temperature of a month.
4.
MULTIPLE CHOICE QUESTION
30 sec • 1 pt
What instrument is used to collect rainfall data?
Barometer
Stevenson screen
Rain gauge
Thermometer
5.
MULTIPLE CHOICE QUESTION
30 sec • 1 pt
What does the acronym T.E.A. stand for in interpreting climate graphs?
Temperature, Evidence, Analysis
Temperature, Elevation, Atmosphere
Trends, Evidence, Anomalies
Time, Environment, Analysis
6.
MULTIPLE CHOICE QUESTION
30 sec • 1 pt
What is the temperature range if the coldest temperature is 3 degrees and the hottest is 17 degrees?
12 degrees
20 degrees
14 degrees
10 degrees
7.
MULTIPLE CHOICE QUESTION
30 sec • 1 pt
Where is the rainfall axis typically located on a climate graph?
On the left of the graph
On the top of the graph
On the right of the graph
At the bottom of the graph
Access all questions and much more by creating a free account
Create resources
Host any resource
Get auto-graded reports
Continue with Google

Continue with Email
Continue with Classlink
Continue with Clever
or continue with
Microsoft
%20(1).png)
Apple
Others
Already have an account?
