Analyzing Graph Trends and Emissions
Interactive Video
•
Geography
•
9th - 10th Grade
•
Practice Problem
•
Hard

Patricia Brown
FREE Resource
Read more
10 questions
Show all answers
1.
MULTIPLE CHOICE QUESTION
30 sec • 1 pt
What is the main focus of the video tutorial?
Calculating carbon emissions
Understanding fuel efficiency
Describing trends from graphs
Analyzing power station data
2.
MULTIPLE CHOICE QUESTION
30 sec • 1 pt
What is the basic method for describing graph trends?
Focusing only on the x-axis
Dividing the graph into sections
Ignoring the y-axis
Using random data points
3.
MULTIPLE CHOICE QUESTION
30 sec • 1 pt
What is a key factor in describing graph trends accurately?
Ignoring the graph title
Using exact labels from the graph
Avoiding specific data points
Focusing only on visual elements
4.
MULTIPLE CHOICE QUESTION
30 sec • 1 pt
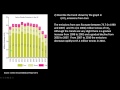
How did the overall carbon dioxide emissions trend change from 1998 to 2002?
Fluctuated randomly
Remained constant
Increased gradually
Decreased sharply
5.
MULTIPLE CHOICE QUESTION
30 sec • 1 pt
What is a common mistake when describing graph trends?
Ignoring the rate of change
Focusing on the x-axis
Describing the rate of change
Using too much data
6.
MULTIPLE CHOICE QUESTION
30 sec • 1 pt
What is a potential reason for the sharp decrease in overall emissions after 2007?
Increase in carbon dioxide production
Introduction of more fuel-efficient vehicles
Decrease in fuel prices
Increase in vehicle numbers
7.
MULTIPLE CHOICE QUESTION
30 sec • 1 pt
What was the trend in carbon dioxide emissions from cars between 1998 and 2007?
A clear upward trend
A clear downward trend
Constant throughout
Fluctuating with no clear trend
Access all questions and much more by creating a free account
Create resources
Host any resource
Get auto-graded reports
Continue with Google

Continue with Email
Continue with Classlink
Continue with Clever
or continue with
Microsoft
%20(1).png)
Apple
Others
Already have an account?
