Statistical Analysis in Education
Interactive Video
•
Mathematics
•
9th - 10th Grade
•
Practice Problem
•
Hard

Patricia Brown
FREE Resource
Read more
10 questions
Show all answers
1.
MULTIPLE CHOICE QUESTION
30 sec • 1 pt
What is the primary purpose of using a Z-Test in the context of the municipal school complaint?
To directly inspect the food quality
To statistically analyze the students' weight
To compare the school’s budget with other schools
To interview the students about their meals
2.
MULTIPLE CHOICE QUESTION
30 sec • 1 pt
Why is the practical method of inspecting food not reliable in this context?
It is too expensive
It only provides information for one day
It is not allowed by the school
It requires too many resources
3.
MULTIPLE CHOICE QUESTION
30 sec • 1 pt
What statistical data is used to evaluate the students' weight in the municipal school?
Average age and standard deviation
Average weight and height
Average weight and standard deviation
Average height and age
4.
MULTIPLE CHOICE QUESTION
30 sec • 1 pt
What is the average weight of 10-year-old boys according to the statistical data?
29.5 kgs
30 kgs
32 kgs
35 kgs
5.
MULTIPLE CHOICE QUESTION
30 sec • 1 pt
What does the null hypothesis state in the context of the municipal school study?
The students are underfed
There is a significant difference between the school and the population
The students are overweight
There is no significant difference between the school and the population
6.
MULTIPLE CHOICE QUESTION
30 sec • 1 pt
What is the significance level used in the study?
0.01
0.10
0.15
0.05
7.
MULTIPLE CHOICE QUESTION
30 sec • 1 pt
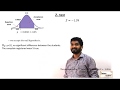
What is the formula for calculating the Z value?
Mean divided by population mean times standard deviation
Mean times population mean divided by standard deviation
Mean minus population mean divided by standard deviation
Mean plus population mean divided by standard deviation
Access all questions and much more by creating a free account
Create resources
Host any resource
Get auto-graded reports
Continue with Google

Continue with Email
Continue with Classlink
Continue with Clever
or continue with
Microsoft
%20(1).png)
Apple
Others
Already have an account?
Popular Resources on Wayground

15 questions
Fractions on a Number Line
Quiz
•
3rd Grade
20 questions
Equivalent Fractions
Quiz
•
3rd Grade
25 questions
Multiplication Facts
Quiz
•
5th Grade
29 questions
Alg. 1 Section 5.1 Coordinate Plane
Quiz
•
9th Grade
22 questions
fractions
Quiz
•
3rd Grade
11 questions
FOREST Effective communication
Lesson
•
KG
20 questions
Main Idea and Details
Quiz
•
5th Grade
20 questions
Context Clues
Quiz
•
6th Grade
Discover more resources for Mathematics
29 questions
Alg. 1 Section 5.1 Coordinate Plane
Quiz
•
9th Grade
20 questions
Graphing Inequalities on a Number Line
Quiz
•
6th - 9th Grade
20 questions
Box and Whisker Plots
Quiz
•
9th Grade
18 questions
Exponential Growth and Decay
Quiz
•
9th Grade
20 questions
Function or Not a Function
Quiz
•
8th - 9th Grade
20 questions
SSS/SAS
Quiz
•
9th - 12th Grade
14 questions
Making Inferences From Samples
Quiz
•
7th - 12th Grade
23 questions
CCG - CH8 Polygon angles and area Review
Quiz
•
9th - 12th Grade