Understanding Motion Graphs and Acceleration
Interactive Video
•
Physics
•
9th - 10th Grade
•
Practice Problem
•
Hard

Patricia Brown
FREE Resource
Read more
10 questions
Show all answers
1.
MULTIPLE CHOICE QUESTION
30 sec • 1 pt
What is the primary focus of the video tutorial on motion graphs?
To provide a detailed history of motion graphs.
To explore the theoretical aspects of motion graphs.
To go through examples of exam-style questions related to motion graphs.
To discuss the latest research on motion graphs.
2.
MULTIPLE CHOICE QUESTION
30 sec • 1 pt
When analyzing an acceleration-time graph, what should you calculate to find the velocity?
The intercept of the graph.
The area under the graph.
The gradient of the graph.
The slope of the line.
3.
MULTIPLE CHOICE QUESTION
30 sec • 1 pt
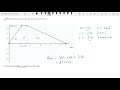
In the toy car example, what is the maximum velocity achieved by the car?
5.0 meters per second
3.6 meters per second
4.0 meters per second
2.5 meters per second
4.
MULTIPLE CHOICE QUESTION
30 sec • 1 pt
How is the total distance traveled by the car calculated using the velocity-time graph?
By measuring the length of the graph.
By counting the number of peaks in the graph.
By finding the slope of the graph.
By calculating the area under the graph.
5.
MULTIPLE CHOICE QUESTION
30 sec • 1 pt
What is the initial displacement of the ball when it is dropped in the bouncing balls example?
It starts at the lowest point.
It starts at the midpoint.
It starts at the maximum height.
It starts at zero.
6.
MULTIPLE CHOICE QUESTION
30 sec • 1 pt
Which graph represents the correct displacement-time graph for a ball that is dropped and bounces once?
A graph with a decreasing gradient.
A graph with a constant gradient.
A graph with a fluctuating gradient.
A graph with an increasing gradient.
7.
MULTIPLE CHOICE QUESTION
30 sec • 1 pt
In the bus motion example, what type of acceleration is observed in section A?
Variable acceleration
Negative acceleration
Constant acceleration
Zero acceleration
Access all questions and much more by creating a free account
Create resources
Host any resource
Get auto-graded reports
Continue with Google

Continue with Email
Continue with Classlink
Continue with Clever
or continue with
Microsoft
%20(1).png)
Apple
Others
Already have an account?
Popular Resources on Wayground

7 questions
History of Valentine's Day
Interactive video
•
4th Grade
15 questions
Fractions on a Number Line
Quiz
•
3rd Grade
20 questions
Equivalent Fractions
Quiz
•
3rd Grade
25 questions
Multiplication Facts
Quiz
•
5th Grade
22 questions
fractions
Quiz
•
3rd Grade
15 questions
Valentine's Day Trivia
Quiz
•
3rd Grade
20 questions
Main Idea and Details
Quiz
•
5th Grade
20 questions
Context Clues
Quiz
•
6th Grade
Discover more resources for Physics
10 questions
Exit Check 3.1 - Kepler's Laws
Quiz
•
9th Grade
10 questions
Exit Check 3.2 - Force of Gavity
Quiz
•
9th Grade
27 questions
Simple Machines and Mechanical Advantage Quiz
Quiz
•
9th Grade
20 questions
Unit 8 - Energy Test - 2025-2026
Quiz
•
9th - 12th Grade
19 questions
Generators, Motors, and Transformers
Quiz
•
8th Grade - University
24 questions
IPC Thermal Energy Test Corrections
Quiz
•
9th Grade
14 questions
Bill Nye Waves
Interactive video
•
9th - 12th Grade
20 questions
Ohm's Law
Quiz
•
9th Grade