Cell Respiration Experiment Analysis
Interactive Video
•
Biology
•
9th - 10th Grade
•
Practice Problem
•
Hard

Patricia Brown
FREE Resource
Read more
10 questions
Show all answers
1.
MULTIPLE CHOICE QUESTION
30 sec • 1 pt
What is the primary purpose of the cell respiration experiment discussed in the video?
To measure the growth rate of peas
To determine the amount of CO2 and O2 involved in pea respiration
To test the durability of lab equipment
To explore the effects of light on plant growth
2.
MULTIPLE CHOICE QUESTION
30 sec • 1 pt
Which equipment is essential for measuring gases in the experiment?
pH meter and hygrometer
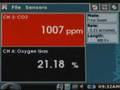
CO2 and O2 gas sensors
Spectrophotometer and calorimeter
Thermometer and barometer
3.
MULTIPLE CHOICE QUESTION
30 sec • 1 pt
How many peas should be measured out for the experiment?
10 to 15
20 to 25
30 to 35
40 to 45
4.
MULTIPLE CHOICE QUESTION
30 sec • 1 pt
What is the purpose of the biochamber in the experiment?
To measure the weight of the peas
To provide light for the peas
To allow simultaneous use of CO2 and O2 sensors
To heat the peas
5.
MULTIPLE CHOICE QUESTION
30 sec • 1 pt
What is the warm-up period for the CO2 gas sensor?
30 seconds
60 seconds
120 seconds
90 seconds
6.
MULTIPLE CHOICE QUESTION
30 sec • 1 pt
What should be done after the 90-second warm-up period of the CO2 sensor?
Start data collection
Turn off the sensors
Add more peas to the chamber
Change the sensor settings
7.
MULTIPLE CHOICE QUESTION
30 sec • 1 pt
How is the rate of respiration determined from the graphs?
By counting the number of peaks
By finding the slope of the CO2 and O2 graphs
By measuring the height of the graph
By comparing the graphs to a standard
Access all questions and much more by creating a free account
Create resources
Host any resource
Get auto-graded reports
Continue with Google

Continue with Email
Continue with Classlink
Continue with Clever
or continue with
Microsoft
%20(1).png)
Apple
Others
Already have an account?
