Phase Change Diagrams and Energy
Interactive Video
•
Physics
•
9th - 10th Grade
•
Practice Problem
•
Hard

Patricia Brown
FREE Resource
Read more
10 questions
Show all answers
1.
MULTIPLE CHOICE QUESTION
30 sec • 1 pt
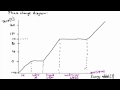
What is the primary purpose of a phase change diagram?
To show the relationship between temperature and energy added
To calculate the speed of phase changes
To determine the color of a substance
To measure the weight of a substance
2.
MULTIPLE CHOICE QUESTION
30 sec • 1 pt
At what temperature does water start to boil in the phase change diagram?
0°C
50°C
100°C
150°C
3.
MULTIPLE CHOICE QUESTION
30 sec • 1 pt
What phases are present when water is at 0°C in the phase change diagram?
Water and steam
Water and ice
Only liquid water
Only ice
4.
MULTIPLE CHOICE QUESTION
30 sec • 1 pt
Why does the temperature remain constant during the melting phase?
Because no energy is added
Because energy is used to increase kinetic energy
Because the substance is cooling down
Because energy is used to increase potential energy
5.
MULTIPLE CHOICE QUESTION
30 sec • 1 pt
What happens to the potential energy during the boiling phase?
It remains constant
It decreases
It fluctuates
It increases
6.
MULTIPLE CHOICE QUESTION
30 sec • 1 pt
What is the role of potential energy during phase changes?
It is used to decrease pressure
It is used to break molecular bonds
It is used to change color
It is used to increase temperature
7.
MULTIPLE CHOICE QUESTION
30 sec • 1 pt
How does the phase change diagram for water differ from that of mercury?
Water is a gas at room temperature
Mercury is a liquid at room temperature
Mercury is a solid at room temperature
Water has a higher boiling point
Access all questions and much more by creating a free account
Create resources
Host any resource
Get auto-graded reports
Continue with Google

Continue with Email
Continue with Classlink
Continue with Clever
or continue with
Microsoft
%20(1).png)
Apple
Others
Already have an account?
