Understanding Correlation Coefficients
Interactive Video
•
Mathematics
•
9th - 10th Grade
•
Practice Problem
•
Hard

Patricia Brown
FREE Resource
Read more
10 questions
Show all answers
1.
MULTIPLE CHOICE QUESTION
30 sec • 1 pt
What is the primary purpose of drawing a line of best fit on a scatter plot?
To represent the average trend of the data
To make the graph look more appealing
To connect all the data points
To highlight the outliers
2.
MULTIPLE CHOICE QUESTION
30 sec • 1 pt
Which of the following indicates a poor line of best fit?
The line is parallel to the x-axis
The line passes through the center of the data points
The line moves in the opposite direction of the data trend
The line has a positive slope
3.
MULTIPLE CHOICE QUESTION
30 sec • 1 pt
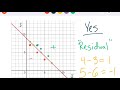
What does a residual represent in the context of a line of best fit?
The distance between a data point and the line
The slope of the line
The average value of the data set
The total number of data points
4.
MULTIPLE CHOICE QUESTION
30 sec • 1 pt
If a data point is below the line of best fit, what is the sign of its residual?
Negative
Positive
Zero
Undefined
5.
MULTIPLE CHOICE QUESTION
30 sec • 1 pt
What does a correlation coefficient of 1 indicate?
No correlation
A perfect negative correlation
A weak positive correlation
A perfect positive correlation
6.
MULTIPLE CHOICE QUESTION
30 sec • 1 pt
How is a correlation coefficient of 0.9 interpreted?
A weak positive correlation
A strong positive correlation
No correlation
A strong negative correlation
7.
MULTIPLE CHOICE QUESTION
30 sec • 1 pt
What does a correlation coefficient of 0 signify?
A weak negative correlation
No correlation
A perfect negative correlation
A perfect positive correlation
Access all questions and much more by creating a free account
Create resources
Host any resource
Get auto-graded reports
Continue with Google

Continue with Email
Continue with Classlink
Continue with Clever
or continue with
Microsoft
%20(1).png)
Apple
Others
Already have an account?
Popular Resources on Wayground

15 questions
Fractions on a Number Line
Quiz
•
3rd Grade
20 questions
Equivalent Fractions
Quiz
•
3rd Grade
25 questions
Multiplication Facts
Quiz
•
5th Grade
54 questions
Analyzing Line Graphs & Tables
Quiz
•
4th Grade
22 questions
fractions
Quiz
•
3rd Grade
20 questions
Main Idea and Details
Quiz
•
5th Grade
20 questions
Context Clues
Quiz
•
6th Grade
15 questions
Equivalent Fractions
Quiz
•
4th Grade
Discover more resources for Mathematics
20 questions
Graphing Inequalities on a Number Line
Quiz
•
6th - 9th Grade
18 questions
SAT Prep: Ratios, Proportions, & Percents
Quiz
•
9th - 10th Grade
12 questions
Exponential Growth and Decay
Quiz
•
9th Grade
12 questions
Parallel Lines Cut by a Transversal
Quiz
•
10th Grade
12 questions
Add and Subtract Polynomials
Quiz
•
9th - 12th Grade
15 questions
Combine Like Terms and Distributive Property
Quiz
•
8th - 9th Grade
20 questions
Function or Not a Function
Quiz
•
8th - 9th Grade
10 questions
Elijah McCoy: Innovations and Impact in Black History
Interactive video
•
6th - 10th Grade