Understanding Normal Distribution Concepts
Interactive Video
•
Mathematics
•
9th - 10th Grade
•
Practice Problem
•
Hard

Patricia Brown
FREE Resource
Read more
10 questions
Show all answers
1.
MULTIPLE CHOICE QUESTION
30 sec • 1 pt
What is the z-score formula used to find the percentage of data above a certain value in a normal distribution?
(Value + Mean) / Standard Deviation
(Mean - Value) / Standard Deviation
(Value - Mean) / Standard Deviation
(Value * Mean) / Standard Deviation
2.
MULTIPLE CHOICE QUESTION
30 sec • 1 pt
If a normal distribution has a mean of 40 and a standard deviation of 6, what is the z-score for the value 50?
1.33
1.67
2.00
1.50
3.
MULTIPLE CHOICE QUESTION
30 sec • 1 pt
What percentage of data is above the value 50 in a normal distribution with a mean of 40 and a standard deviation of 6?
4.75%
5.25%
3.75%
6.25%
4.
MULTIPLE CHOICE QUESTION
30 sec • 1 pt
How do you find the percentage of data between two values in a normal distribution?
Add the z-scores of both values and find the area using the standard normal distribution table.
Divide the z-scores of both values and find the area using the standard normal distribution table.
Multiply the z-scores of both values and find the area using the standard normal distribution table.
Calculate z-scores for both values and subtract the smaller area from the larger area using the standard normal distribution table.
5.
MULTIPLE CHOICE QUESTION
30 sec • 1 pt
What is the z-score for the value 58 in a normal distribution with a mean of 40 and a standard deviation of 6?
3.00
3.33
2.33
2.67
6.
MULTIPLE CHOICE QUESTION
30 sec • 1 pt
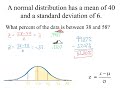
What is the percentage of data between the values 38 and 58 in a normal distribution with a mean of 40 and a standard deviation of 6?
62.80%
60.00%
58.00%
65.00%
7.
MULTIPLE CHOICE QUESTION
30 sec • 1 pt
How do you find the values in the top 20% of a normal distribution?
Find the z-score for the 20th percentile and calculate the corresponding data value using the mean and standard deviation.
Find the z-score for the 90th percentile and calculate the corresponding data value using the mean and standard deviation.
Find the z-score for the 80th percentile and calculate the corresponding data value using the mean and standard deviation.
Find the z-score for the 50th percentile and calculate the corresponding data value using the mean and standard deviation.
Access all questions and much more by creating a free account
Create resources
Host any resource
Get auto-graded reports
Continue with Google

Continue with Email
Continue with Classlink
Continue with Clever
or continue with
Microsoft
%20(1).png)
Apple
Others
Already have an account?
Popular Resources on Wayground

7 questions
History of Valentine's Day
Interactive video
•
4th Grade
15 questions
Fractions on a Number Line
Quiz
•
3rd Grade
20 questions
Equivalent Fractions
Quiz
•
3rd Grade
25 questions
Multiplication Facts
Quiz
•
5th Grade
22 questions
fractions
Quiz
•
3rd Grade
15 questions
Valentine's Day Trivia
Quiz
•
3rd Grade
20 questions
Main Idea and Details
Quiz
•
5th Grade
20 questions
Context Clues
Quiz
•
6th Grade
Discover more resources for Mathematics
20 questions
Graphing Inequalities on a Number Line
Quiz
•
6th - 9th Grade
20 questions
Exponent Properties
Quiz
•
9th Grade
15 questions
Combine Like Terms and Distributive Property
Quiz
•
8th - 9th Grade
20 questions
Function or Not a Function
Quiz
•
8th - 9th Grade
10 questions
Factor Quadratic Expressions with Various Coefficients
Quiz
•
9th - 12th Grade
10 questions
Elijah McCoy: Innovations and Impact in Black History
Interactive video
•
6th - 10th Grade
21 questions
Factoring Trinomials (a=1)
Quiz
•
9th Grade
5 questions
Triangle Congruence Theorems
Interactive video
•
9th - 12th Grade