Distance-Time Graph Analysis
Interactive Video
•
Physics
•
9th - 10th Grade
•
Practice Problem
•
Hard

Patricia Brown
FREE Resource
Read more
10 questions
Show all answers
1.
MULTIPLE CHOICE QUESTION
30 sec • 1 pt
What is the main task described in the introduction of the video?
Calculating speed from graphs
Solving mathematical equations
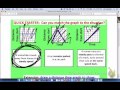
Matching situations with graphs
Drawing distance-time graphs
2.
MULTIPLE CHOICE QUESTION
30 sec • 1 pt
In the first situation, why is the first graph option eliminated?
The graph shows a decrease in speed
The graph is not linear
The graph shows a return journey
The graph is too complex
3.
MULTIPLE CHOICE QUESTION
30 sec • 1 pt
What does a flat line on a distance-time graph indicate?
Decreasing speed
Constant speed
No change in distance
Increasing speed
4.
MULTIPLE CHOICE QUESTION
30 sec • 1 pt
Which graph correctly represents a motorbike traveling away from home at a steady speed?
A flat line
A linear increasing line
A linear decreasing line
A curved line
5.
MULTIPLE CHOICE QUESTION
30 sec • 1 pt
What does the flat line in the second situation's graph represent?
The car is accelerating
The car is parked
The car is moving at a constant speed
The car is reversing
6.
MULTIPLE CHOICE QUESTION
30 sec • 1 pt
In the runner's situation, what does the second part of the graph indicate?
The runner is stationary
The runner is returning at the same speed
The runner is slowing down
The runner is speeding up
7.
MULTIPLE CHOICE QUESTION
30 sec • 1 pt
Why is the runner's graph described as linear in both segments?
The runner stops midway
The runner maintains a constant speed
The runner changes speed frequently
The runner accelerates and decelerates
Access all questions and much more by creating a free account
Create resources
Host any resource
Get auto-graded reports
Continue with Google

Continue with Email
Continue with Classlink
Continue with Clever
or continue with
Microsoft
%20(1).png)
Apple
Others
Already have an account?
Popular Resources on Wayground

15 questions
Fractions on a Number Line
Quiz
•
3rd Grade
20 questions
Equivalent Fractions
Quiz
•
3rd Grade
25 questions
Multiplication Facts
Quiz
•
5th Grade
54 questions
Analyzing Line Graphs & Tables
Quiz
•
4th Grade
22 questions
fractions
Quiz
•
3rd Grade
20 questions
Main Idea and Details
Quiz
•
5th Grade
20 questions
Context Clues
Quiz
•
6th Grade
15 questions
Equivalent Fractions
Quiz
•
4th Grade
Discover more resources for Physics
27 questions
Simple Machines and Mechanical Advantage Quiz
Quiz
•
9th Grade
10 questions
Understanding Heat, Thermal Energy, and Temperature
Interactive video
•
9th - 10th Grade
10 questions
Newton's Laws of Motion
Quiz
•
10th Grade
10 questions
unit 10 -- electric forces and fields
Lesson
•
9th - 12th Grade
21 questions
Diffraction, Reflection, Refraction
Quiz
•
9th - 12th Grade
15 questions
Position vs. Time and Velocity vs. Time Graphs
Quiz
•
10th - 12th Grade
10 questions
Types of Chemical Reactions
Quiz
•
10th Grade
11 questions
Conservation of Momentum: Physics in Motion Video
Interactive video
•
10th Grade