Soda Consumption and Correlation Concepts
Interactive Video
•
Mathematics
•
6th - 7th Grade
•
Practice Problem
•
Hard

Patricia Brown
FREE Resource
Read more
10 questions
Show all answers
1.
MULTIPLE CHOICE QUESTION
30 sec • 1 pt
What is the purpose of using graphs in predictions?
To make data look more colorful
To predict possible solutions or answer questions
To confuse the audience
To avoid using numbers
2.
MULTIPLE CHOICE QUESTION
30 sec • 1 pt
What type of scatter plot shows no correlation?
Dots forming a curve
Dots forming a circle
Dots forming a straight line
Dots scattered randomly
3.
MULTIPLE CHOICE QUESTION
30 sec • 1 pt
Which of the following is an example of a positive correlation?
As soda consumption increases, age decreases
As age increases, height decreases
As study time increases, test scores decrease
As study time increases, test scores increase
4.
MULTIPLE CHOICE QUESTION
30 sec • 1 pt
What is the relationship between age and soda consumption according to the example?
Inverse correlation
No correlation
Negative correlation
Positive correlation
5.
MULTIPLE CHOICE QUESTION
30 sec • 1 pt
What does a negative correlation indicate?
Both variables increase together
One variable increases while the other decreases
There is no relationship between the variables
Both variables decrease together
6.
MULTIPLE CHOICE QUESTION
30 sec • 1 pt
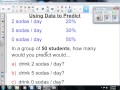
In the survey example, what percentage of students drink two sodas per day?
20%
10%
50%
30%
7.
MULTIPLE CHOICE QUESTION
30 sec • 1 pt
How many students out of 50 are predicted to drink two sodas per day?
15
10
20
5
Access all questions and much more by creating a free account
Create resources
Host any resource
Get auto-graded reports
Continue with Google

Continue with Email
Continue with Classlink
Continue with Clever
or continue with
Microsoft
%20(1).png)
Apple
Others
Already have an account?
Similar Resources on Wayground

6 questions
The Beginning of Everything
Interactive video
•
6th Grade
8 questions
MAD Mean Absolute Deviation
Interactive video
•
6th Grade
9 questions
Viagem de Vasco da Gama - Quizzies
Interactive video
•
7th Grade
11 questions
Exploring Constant Rate of Change Concepts
Interactive video
•
6th - 10th Grade
Popular Resources on Wayground
8 questions
Spartan Way - Classroom Responsible
Quiz
•
9th - 12th Grade
15 questions
Fractions on a Number Line
Quiz
•
3rd Grade
14 questions
Boundaries & Healthy Relationships
Lesson
•
6th - 8th Grade
20 questions
Equivalent Fractions
Quiz
•
3rd Grade
3 questions
Integrity and Your Health
Lesson
•
6th - 8th Grade
25 questions
Multiplication Facts
Quiz
•
5th Grade
9 questions
FOREST Perception
Lesson
•
KG
20 questions
Main Idea and Details
Quiz
•
5th Grade
Discover more resources for Mathematics
12 questions
Review: Surface Area of Rectangular and Triangular Prisms
Quiz
•
6th Grade
36 questions
6th Grade Math STAAR Review
Quiz
•
6th Grade
14 questions
Volume of rectangular prisms
Quiz
•
7th Grade
20 questions
Graphing Inequalities on a Number Line
Quiz
•
6th - 9th Grade
26 questions
Graphing Inequalities on a Number Line
Quiz
•
6th Grade
15 questions
Distributive Property & Review
Quiz
•
6th Grade
20 questions
Math Review
Quiz
•
6th Grade
15 questions
Mean, Median, Mode, and Range
Quiz
•
6th Grade