Spectroscopy in Astronomy Concepts
Interactive Video
•
Physics
•
9th - 10th Grade
•
Practice Problem
•
Hard

Patricia Brown
FREE Resource
Read more
10 questions
Show all answers
1.
MULTIPLE CHOICE QUESTION
30 sec • 1 pt
What is the primary purpose of spectroscopy in astronomy?
To identify the age of the universe
To measure the distance of stars
To determine the composition and conditions of astronomical bodies
To calculate the speed of light
2.
MULTIPLE CHOICE QUESTION
30 sec • 1 pt
What does a unique spectral signature of an atom indicate?
The atom's weight
The atom's electron transitions
The atom's size
The atom's color
3.
MULTIPLE CHOICE QUESTION
30 sec • 1 pt
Which type of spectrum is characterized by no gaps and is typically seen in solids and dense gases?
Discontinuous spectrum
Emission line spectrum
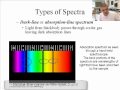
Absorption line spectrum
Continuous spectrum
4.
MULTIPLE CHOICE QUESTION
30 sec • 1 pt
What is an emission line spectrum typically produced by?
Solid objects
Cold dense gases
Hot tenuous gases
Liquid surfaces
5.
MULTIPLE CHOICE QUESTION
30 sec • 1 pt
What is the main difference between an emission line spectrum and an absorption line spectrum?
Emission line spectrum is produced by hot gases, absorption line spectrum by cooler gases
Emission line spectrum is only found in stars, absorption line spectrum is not
Emission line spectrum is continuous, absorption line spectrum is not
Emission line spectrum shows dark lines, absorption line spectrum shows bright lines
6.
MULTIPLE CHOICE QUESTION
30 sec • 1 pt
Why do scientists prefer to analyze spectra graphically?
It is more visually appealing
It allows for easier identification of elements
It is faster than other methods
It requires less equipment
7.
MULTIPLE CHOICE QUESTION
30 sec • 1 pt
What can be determined by analyzing the dips in a solar spectrum graph?
The temperature of the Sun
The distance of the Sun from Earth
The elements present in the Sun
The age of the Sun
Access all questions and much more by creating a free account
Create resources
Host any resource
Get auto-graded reports
Continue with Google

Continue with Email
Continue with Classlink
Continue with Clever
or continue with
Microsoft
%20(1).png)
Apple
Others
Already have an account?
