Understanding Linear and Non-Linear Graphs
Interactive Video
•
Mathematics
•
6th - 8th Grade
•
Practice Problem
•
Hard

Patricia Brown
FREE Resource
Read more
10 questions
Show all answers
1.
MULTIPLE CHOICE QUESTION
30 sec • 1 pt
What is the primary purpose of a graph in data analysis?
To replace data tables
To visually represent data and show relationships between variables
To provide a textual description of data
To confuse the viewer
2.
MULTIPLE CHOICE QUESTION
30 sec • 1 pt
In a line graph, what does the responding variable do?
It remains constant
It changes in response to the manipulated variable
It changes randomly
It is not shown on the graph
3.
MULTIPLE CHOICE QUESTION
30 sec • 1 pt
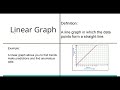
What is a key characteristic of a linear graph?
It forms a curved line
It forms a straight line
It has no relationship between variables
It is always a bar graph
4.
MULTIPLE CHOICE QUESTION
30 sec • 1 pt
Why are linear graphs useful in data analysis?
They are easier to draw
They help find trends and make predictions
They show random data points
They are always more accurate
5.
MULTIPLE CHOICE QUESTION
30 sec • 1 pt
What distinguishes a non-linear graph from a linear graph?
Non-linear graphs are always incorrect
Non-linear graphs have a curved or bent line
Non-linear graphs have a straight line
Non-linear graphs have no data points
6.
MULTIPLE CHOICE QUESTION
30 sec • 1 pt
What does a non-linear graph indicate about the relationship between variables?
There is no relationship
There is a random relationship
There is a form of relationship, but not linear
The relationship is always decreasing
7.
MULTIPLE CHOICE QUESTION
30 sec • 1 pt
What is an anomalous data point?
A data point that deviates significantly from the trend line
A data point that fits perfectly on the trend line
A data point that is always at the start
A data point that is always at the end
Access all questions and much more by creating a free account
Create resources
Host any resource
Get auto-graded reports
Continue with Google

Continue with Email
Continue with Classlink
Continue with Clever
or continue with
Microsoft
%20(1).png)
Apple
Others
Already have an account?
