Data Representation and Evaluation Concepts
Interactive Video
•
Physics
•
9th - 10th Grade
•
Practice Problem
•
Hard

Patricia Brown
FREE Resource
Read more
10 questions
Show all answers
1.
MULTIPLE CHOICE QUESTION
30 sec • 1 pt
What is a better way to formulate a research question?
How far will the projectile go?
What is the effect of angle on the range of a projectile?
How does the color of the projectile affect its speed?
What is the best angle for launching a projectile?
2.
MULTIPLE CHOICE QUESTION
30 sec • 1 pt
Why is it important to provide a scientific justification for a hypothesis?
To make it sound more complex
To ensure it is based on scientific principles
To confuse the reader
To make it longer
3.
MULTIPLE CHOICE QUESTION
30 sec • 1 pt
What should be included in a data table to make it clear?
Colorful graphics
A description of the experiment
Only numbers without any headings
A title, column headings, and units
4.
MULTIPLE CHOICE QUESTION
30 sec • 1 pt
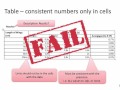
Why should units not be included inside the cells of a data table?
To save space
To maintain consistency and clarity
To make it look neat
To confuse the reader
5.
MULTIPLE CHOICE QUESTION
30 sec • 1 pt
What is the correct way to place variables on a graph?
Independent variable on the y-axis
Dependent variable on both axes
Dependent variable on the x-axis
Independent variable on the x-axis
6.
MULTIPLE CHOICE QUESTION
30 sec • 1 pt
Why should a scatter graph be used instead of a dot-to-dot graph?
To make it look more artistic
To make it easier to draw
To show the overall trend and pattern
To connect all data points
7.
MULTIPLE CHOICE QUESTION
30 sec • 1 pt
What is the purpose of a line of best fit on a graph?
To make the graph look symmetrical
To highlight the highest point
To show the average trend
To connect all data points
Access all questions and much more by creating a free account
Create resources
Host any resource
Get auto-graded reports
Continue with Google

Continue with Email
Continue with Classlink
Continue with Clever
or continue with
Microsoft
%20(1).png)
Apple
Others
Already have an account?
Popular Resources on Wayground

15 questions
Fractions on a Number Line
Quiz
•
3rd Grade
20 questions
Equivalent Fractions
Quiz
•
3rd Grade
25 questions
Multiplication Facts
Quiz
•
5th Grade
54 questions
Analyzing Line Graphs & Tables
Quiz
•
4th Grade
22 questions
fractions
Quiz
•
3rd Grade
20 questions
Main Idea and Details
Quiz
•
5th Grade
20 questions
Context Clues
Quiz
•
6th Grade
15 questions
Equivalent Fractions
Quiz
•
4th Grade
Discover more resources for Physics
27 questions
Simple Machines and Mechanical Advantage Quiz
Quiz
•
9th Grade
10 questions
Understanding Heat, Thermal Energy, and Temperature
Interactive video
•
9th - 10th Grade
10 questions
Newton's Laws of Motion
Quiz
•
10th Grade
10 questions
unit 10 -- electric forces and fields
Lesson
•
9th - 12th Grade
21 questions
Diffraction, Reflection, Refraction
Quiz
•
9th - 12th Grade
15 questions
Position vs. Time and Velocity vs. Time Graphs
Quiz
•
10th - 12th Grade
10 questions
Types of Chemical Reactions
Quiz
•
10th Grade
11 questions
Conservation of Momentum: Physics in Motion Video
Interactive video
•
10th Grade