Understanding Trend Lines and Correlation
Interactive Video
•
Mathematics
•
9th - 10th Grade
•
Practice Problem
•
Hard

Patricia Brown
FREE Resource
Read more
10 questions
Show all answers
1.
MULTIPLE CHOICE QUESTION
30 sec • 1 pt
What is the primary purpose of using scatter plots in data analysis?
To determine the median value
To find the mode of the data set
To show the relationship between two data groups
To calculate the average of data points
2.
MULTIPLE CHOICE QUESTION
30 sec • 1 pt
What is a trend line used for in a scatter plot?
To connect all data points
To show the relationship more clearly
To highlight the highest data point
To mark the lowest data point
3.
MULTIPLE CHOICE QUESTION
30 sec • 1 pt
How is the slope of a trend line determined?
By adding the y-values of two points
By dividing the sum of x-values by y-values
By dividing the difference in y-values by the difference in x-values
By subtracting the x-values of two points
4.
MULTIPLE CHOICE QUESTION
30 sec • 1 pt
What is the equation form used to determine a trend line?
x = my + b
y - y1 = m(x - x1)
y = mx + b
x - x1 = m(y - y1)
5.
MULTIPLE CHOICE QUESTION
30 sec • 1 pt
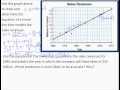
In the context of the video, what is the estimated sales revenue for 1995?
10 million
13 million
20 million
15 million
6.
MULTIPLE CHOICE QUESTION
30 sec • 1 pt
What year is predicted for the company to reach $24 million in sales?
2030
2020
2025
2026
7.
MULTIPLE CHOICE QUESTION
30 sec • 1 pt
Which type of correlation is described as having data points closely clustered along the trend line?
No correlation
Weak positive correlation
Strong positive correlation
Weak negative correlation
Access all questions and much more by creating a free account
Create resources
Host any resource
Get auto-graded reports
Continue with Google

Continue with Email
Continue with Classlink
Continue with Clever
or continue with
Microsoft
%20(1).png)
Apple
Others
Already have an account?
Similar Resources on Wayground

6 questions
Find the parabola given the vertex and point
Interactive video
•
9th - 10th Grade
6 questions
CLEAN : Argentina votes in key runoff election
Interactive video
•
9th - 10th Grade
6 questions
GCSE Secondary Maths Age 13-17 - Number: Multiplication - Explained
Interactive video
•
10th - 12th Grade
6 questions
Coronavirus Model Predicts U.S. Death Toll Of Over 200,000 By October
Interactive video
•
9th - 12th Grade
Popular Resources on Wayground
7 questions
History of Valentine's Day
Interactive video
•
4th Grade
15 questions
Fractions on a Number Line
Quiz
•
3rd Grade
20 questions
Equivalent Fractions
Quiz
•
3rd Grade
25 questions
Multiplication Facts
Quiz
•
5th Grade
22 questions
fractions
Quiz
•
3rd Grade
15 questions
Valentine's Day Trivia
Quiz
•
3rd Grade
20 questions
Main Idea and Details
Quiz
•
5th Grade
20 questions
Context Clues
Quiz
•
6th Grade
Discover more resources for Mathematics
20 questions
Graphing Inequalities on a Number Line
Quiz
•
6th - 9th Grade
20 questions
Exponent Properties
Quiz
•
9th Grade
15 questions
Combine Like Terms and Distributive Property
Quiz
•
8th - 9th Grade
20 questions
Function or Not a Function
Quiz
•
8th - 9th Grade
10 questions
Factor Quadratic Expressions with Various Coefficients
Quiz
•
9th - 12th Grade
10 questions
Elijah McCoy: Innovations and Impact in Black History
Interactive video
•
6th - 10th Grade
21 questions
Factoring Trinomials (a=1)
Quiz
•
9th Grade
5 questions
Triangle Congruence Theorems
Interactive video
•
9th - 12th Grade