Graphing and Data Analysis Concepts
Interactive Video
•
Physics
•
9th - 10th Grade
•
Practice Problem
•
Hard

Patricia Brown
FREE Resource
Read more
10 questions
Show all answers
1.
MULTIPLE CHOICE QUESTION
30 sec • 1 pt
What is the main purpose of the experiment involving batteries and resistors?
To measure the resistance of different materials
To explore graphs and linear relationships
To test the durability of batteries
To calculate the power consumption of a circuit
2.
MULTIPLE CHOICE QUESTION
30 sec • 1 pt
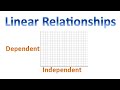
In a graph, where is the independent variable typically plotted?
On the x-axis
On the z-axis
In the legend
On the y-axis
3.
MULTIPLE CHOICE QUESTION
30 sec • 1 pt
What is the role of the dependent variable in a graph?
It is plotted on the x-axis
It remains constant throughout the experiment
It is controlled by the experimenter
It changes in response to the independent variable
4.
MULTIPLE CHOICE QUESTION
30 sec • 1 pt
What should be included in the title of a graph?
Only the independent variable
Only the dependent variable
Both independent and dependent variables
The name of the experimenter
5.
MULTIPLE CHOICE QUESTION
30 sec • 1 pt
What is the significance of labeling axes with units?
It prevents errors in data entry
It is required by graphing software
It helps in understanding the scale of measurement
It makes the graph look more professional
6.
MULTIPLE CHOICE QUESTION
30 sec • 1 pt
What is a line of best fit used for in a graph?
To show the general trend of the data
To highlight the highest data point
To connect all data points
To mark the origin
7.
MULTIPLE CHOICE QUESTION
30 sec • 1 pt
Why is it important to choose points far apart when calculating the slope?
To reduce the number of data points
To avoid crossing the origin
To ensure more significant digits in the slope
To make the graph look more interesting
Access all questions and much more by creating a free account
Create resources
Host any resource
Get auto-graded reports
Continue with Google

Continue with Email
Continue with Classlink
Continue with Clever
or continue with
Microsoft
%20(1).png)
Apple
Others
Already have an account?
Popular Resources on Wayground

15 questions
Fractions on a Number Line
Quiz
•
3rd Grade
20 questions
Equivalent Fractions
Quiz
•
3rd Grade
25 questions
Multiplication Facts
Quiz
•
5th Grade
54 questions
Analyzing Line Graphs & Tables
Quiz
•
4th Grade
22 questions
fractions
Quiz
•
3rd Grade
20 questions
Main Idea and Details
Quiz
•
5th Grade
20 questions
Context Clues
Quiz
•
6th Grade
15 questions
Equivalent Fractions
Quiz
•
4th Grade
Discover more resources for Physics
27 questions
Simple Machines and Mechanical Advantage Quiz
Quiz
•
9th Grade
10 questions
Understanding Heat, Thermal Energy, and Temperature
Interactive video
•
9th - 10th Grade
10 questions
Newton's Laws of Motion
Quiz
•
10th Grade
10 questions
unit 10 -- electric forces and fields
Lesson
•
9th - 12th Grade
21 questions
Diffraction, Reflection, Refraction
Quiz
•
9th - 12th Grade
15 questions
Position vs. Time and Velocity vs. Time Graphs
Quiz
•
10th - 12th Grade
10 questions
Types of Chemical Reactions
Quiz
•
10th Grade
11 questions
Conservation of Momentum: Physics in Motion Video
Interactive video
•
10th Grade