Spectroscopy and Stellar Analysis
Interactive Video
•
Physics
•
9th - 10th Grade
•
Practice Problem
•
Hard

Patricia Brown
FREE Resource
Read more
5 questions
Show all answers
1.
MULTIPLE CHOICE QUESTION
30 sec • 1 pt
What tool is used to split a beam of light into its individual wavelengths?
A prism
A diffraction grating
A telescope
A spectrometer
2.
MULTIPLE CHOICE QUESTION
30 sec • 1 pt
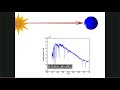
What is the significance of the deep spike in the spectrum of HD 94028?
It indicates a high intensity of light at that wavelength.
It suggests the star is very close to Earth.
It signifies that not much light is radiated at that wavelength.
It shows the presence of helium in the star.
3.
MULTIPLE CHOICE QUESTION
30 sec • 1 pt
Why does the hydrogen alpha line in HD 94028's spectrum appear at a longer wavelength?
The star is rotating rapidly.
The star is moving away from Earth.
The star is moving towards Earth.
The star is stationary.
4.
MULTIPLE CHOICE QUESTION
30 sec • 1 pt
What is the purpose of using MATLAB in the project task?
To find the observed wavelength of the hydrogen alpha line
To simulate the star's lifecycle
To measure the star's temperature
To create a 3D model of the star
5.
MULTIPLE CHOICE QUESTION
30 sec • 1 pt
What can astronomers detect by observing slight oscillations in a star's spectrum over time?
The presence of planets
The star's chemical composition
The star's brightness
The star's age
Access all questions and much more by creating a free account
Create resources
Host any resource
Get auto-graded reports
Continue with Google

Continue with Email
Continue with Microsoft
or continue with

%20(1).png)
Apple
Others
Already have an account?
