Understanding Lines of Best Fit
Interactive Video
•
Mathematics
•
6th - 7th Grade
•
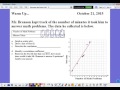
Practice Problem
•
Hard

Patricia Brown
FREE Resource
Read more
10 questions
Show all answers
1.
MULTIPLE CHOICE QUESTION
30 sec • 1 pt
What is the purpose of a scatter plot?
To calculate the mean of data
To show the relationship between two variables
To display the frequency of data
To organize data in a table
2.
MULTIPLE CHOICE QUESTION
30 sec • 1 pt
What does a line of best fit represent in a scatter plot?
The exact path of data points
The average of all data points
The highest and lowest data points
The trend or pattern in the data
3.
MULTIPLE CHOICE QUESTION
30 sec • 1 pt
How do you determine the coordinates for plotting a scatter plot?
By calculating the average of the data
By using the x and y values from the data
By using random numbers
By drawing a line through the data
4.
MULTIPLE CHOICE QUESTION
30 sec • 1 pt
What is a misconception about the line of best fit?
It can be used to make predictions
It should represent the trend of the data
It must pass through all data points
It is drawn using the data points
5.
MULTIPLE CHOICE QUESTION
30 sec • 1 pt
What does a positive correlation indicate?
No relationship between variables
As one variable increases, the other decreases
As one variable increases, the other also increases
The variables are unrelated
6.
MULTIPLE CHOICE QUESTION
30 sec • 1 pt
What is the range of a correlation coefficient?
0 to 100
-2 to 2
-1 to 1
0 to 1
7.
MULTIPLE CHOICE QUESTION
30 sec • 1 pt
How is the correlation coefficient related to the line of best fit?
It shows the average of the data points
It determines the slope of the line
It indicates how well the line represents the data
It measures the distance between data points
Access all questions and much more by creating a free account
Create resources
Host any resource
Get auto-graded reports
Continue with Google

Continue with Email
Continue with Classlink
Continue with Clever
or continue with
Microsoft
%20(1).png)
Apple
Others
Already have an account?
