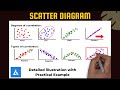
Scatter Diagrams and Correlation Concepts
Interactive Video
•
Other
•
9th - 10th Grade
•
Practice Problem
•
Hard

Thomas White
FREE Resource
Read more
10 questions
Show all answers
1.
MULTIPLE CHOICE QUESTION
30 sec • 1 pt
Which tool is used to identify the most significant factors in a problem?
Pareto Chart
Scatter Diagram
5 Whys
Fishbone Diagram
2.
MULTIPLE CHOICE QUESTION
30 sec • 1 pt
What is another name for a Scatter Diagram?
Bar Graph
X-Y Graph
Pie Chart
Histogram
3.
MULTIPLE CHOICE QUESTION
30 sec • 1 pt
When should you use a Scatter Diagram?
When you need to sort ideas into categories
When you have categorical data
When you have paired numerical data
When you want to create a control chart
4.
MULTIPLE CHOICE QUESTION
30 sec • 1 pt
In the ice cream shop example, what relationship is observed?
Sales remain constant regardless of temperature
Sales decrease as temperature increases
No relationship between temperature and sales
Sales increase as temperature increases
5.
MULTIPLE CHOICE QUESTION
30 sec • 1 pt
What should you consider if a Scatter Diagram shows no clear relationship?
The variables are always unrelated
The diagram is not useful
The data is always incorrect
The data might be stratified
6.
MULTIPLE CHOICE QUESTION
30 sec • 1 pt
What type of correlation is indicated by points falling along a line in a Scatter Diagram?
No Correlation
Perfect Correlation
Partial Correlation
Curved Correlation
7.
MULTIPLE CHOICE QUESTION
30 sec • 1 pt
What is the first step in creating a Scatter Diagram in Excel?
Click on the Insert tab
Select the Scatter chart type
Open the worksheet with the data
Select the data to plot
Access all questions and much more by creating a free account
Create resources
Host any resource
Get auto-graded reports
Continue with Google

Continue with Email
Continue with Classlink
Continue with Clever
or continue with
Microsoft
%20(1).png)
Apple
Others
Already have an account?
Similar Resources on Wayground

6 questions
Fidelity's Yeung: Value Can Be Found Across All Sectors in China
Interactive video
•
11th - 12th Grade
8 questions
Learn More About the North American Computational Linguistics Olympiad
Interactive video
•
9th - 12th Grade
6 questions
Coronavirus Model Predicts U.S. Death Toll Of Over 200,000 By October
Interactive video
•
9th - 12th Grade
2 questions
Deep Learning - Computer Vision for Beginners Using PyTorch - LeNet Overview
Interactive video
•
9th - 10th Grade
6 questions
CLEAN : Alps crash: plane did not likely stall or explode mid air
Interactive video
•
9th - 10th Grade
Popular Resources on Wayground
15 questions
Fractions on a Number Line
Quiz
•
3rd Grade
20 questions
Equivalent Fractions
Quiz
•
3rd Grade
25 questions
Multiplication Facts
Quiz
•
5th Grade
29 questions
Alg. 1 Section 5.1 Coordinate Plane
Quiz
•
9th Grade
22 questions
fractions
Quiz
•
3rd Grade
11 questions
FOREST Effective communication
Lesson
•
KG
20 questions
Main Idea and Details
Quiz
•
5th Grade
20 questions
Context Clues
Quiz
•
6th Grade
Discover more resources for Other
29 questions
Alg. 1 Section 5.1 Coordinate Plane
Quiz
•
9th Grade
20 questions
El Verbo IR Practice
Quiz
•
9th Grade
20 questions
-AR -ER -IR present tense
Quiz
•
10th - 12th Grade
10 questions
Cell Organelles and Their Functions
Interactive video
•
6th - 10th Grade
20 questions
Graphing Inequalities on a Number Line
Quiz
•
6th - 9th Grade
20 questions
Combining Sentences
Lesson
•
9th Grade
22 questions
El Imperfecto
Quiz
•
9th - 12th Grade
20 questions
Box and Whisker Plots
Quiz
•
9th Grade