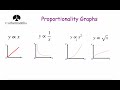
Proportionality Graphs and Their Behaviors
Interactive Video
•
Mathematics
•
9th - 10th Grade
•
Practice Problem
•
Hard

Thomas White
FREE Resource
Read more
10 questions
Show all answers
1.
MULTIPLE CHOICE QUESTION
30 sec • 1 pt
What is the main focus of the video on proportionality graphs?
Studying statistical data analysis
Exploring different types of proportionality graphs
Understanding calculus concepts
Learning about trigonometric functions
2.
MULTIPLE CHOICE QUESTION
30 sec • 1 pt
In a direct proportionality graph where y is proportional to x, what happens to the graph as the constant of proportionality (k) increases?
The graph becomes steeper
The graph becomes a horizontal line
The graph becomes less steep
The graph shifts downwards
3.
MULTIPLE CHOICE QUESTION
30 sec • 1 pt
How does the graph of y inversely proportional to x behave as x increases?
y oscillates
y decreases
y remains constant
y increases
4.
MULTIPLE CHOICE QUESTION
30 sec • 1 pt
What type of graph is formed when y is inversely proportional to x?
Linear graph
Parabolic graph
Exponential graph
Reciprocal graph
5.
MULTIPLE CHOICE QUESTION
30 sec • 1 pt
What is the shape of the graph when y is directly proportional to x squared?
A cubic curve
A hyperbola
A straight line
A parabola
6.
MULTIPLE CHOICE QUESTION
30 sec • 1 pt
When y is directly proportional to x cubed, how does the graph compare to the x squared graph?
It is a horizontal line
It is a straight line
It is less steep
It is steeper
7.
MULTIPLE CHOICE QUESTION
30 sec • 1 pt
What is the starting point of the graph when y is directly proportional to the square root of x?
At (0,1)
At (0,0)
At (1,0)
At (1,1)
Access all questions and much more by creating a free account
Create resources
Host any resource
Get auto-graded reports
Continue with Google

Continue with Email
Continue with Classlink
Continue with Clever
or continue with
Microsoft
%20(1).png)
Apple
Others
Already have an account?
Popular Resources on Wayground

8 questions
Spartan Way - Classroom Responsible
Quiz
•
9th - 12th Grade
15 questions
Fractions on a Number Line
Quiz
•
3rd Grade
14 questions
Boundaries & Healthy Relationships
Lesson
•
6th - 8th Grade
20 questions
Equivalent Fractions
Quiz
•
3rd Grade
3 questions
Integrity and Your Health
Lesson
•
6th - 8th Grade
25 questions
Multiplication Facts
Quiz
•
5th Grade
9 questions
FOREST Perception
Lesson
•
KG
20 questions
Main Idea and Details
Quiz
•
5th Grade
Discover more resources for Mathematics
20 questions
Graphing Inequalities on a Number Line
Quiz
•
6th - 9th Grade
11 questions
Adding and Subtracting Polynomials
Quiz
•
9th Grade
20 questions
Box and Whisker Plots
Quiz
•
9th Grade
18 questions
Exponential Growth and Decay
Quiz
•
9th Grade
12 questions
Equation of a Circle
Lesson
•
10th Grade
12 questions
Exponential Growth and Decay
Quiz
•
9th Grade
14 questions
Making Inferences From Samples
Quiz
•
7th - 12th Grade
24 questions
Solving Linear Equations with Variables on Both Sides
Quiz
•
9th Grade