Understanding Absolute and Local Extrema
Interactive Video
•
Mathematics
•
9th - 10th Grade
•
Practice Problem
•
Hard

Thomas White
FREE Resource
Read more
10 questions
Show all answers
1.
MULTIPLE CHOICE QUESTION
30 sec • 1 pt
What is the primary focus when using a graph to find extrema?
Calculating the area under the curve
Determining the absolute and local maximum and minimum values
Finding the x-intercepts
Identifying the slope of the graph
2.
MULTIPLE CHOICE QUESTION
30 sec • 1 pt
How can local minimums be visualized on a graph?
As the points where the graph intersects the x-axis
As the lowest points in a valley-like structure
As the points where the graph changes direction
As the highest points on the graph
3.
MULTIPLE CHOICE QUESTION
30 sec • 1 pt
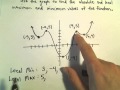
Which point is identified as a local minimum in the graph example?
Negative two comma five
Six comma four
Four comma five
One comma negative four
4.
MULTIPLE CHOICE QUESTION
30 sec • 1 pt
What is the y-value of the local maximum at the point negative two comma five?
Three
Five
Negative four
Four
5.
MULTIPLE CHOICE QUESTION
30 sec • 1 pt
Which of the following points is not a local maximum?
Six comma four
One comma negative four
Four comma five
Negative two comma five
6.
MULTIPLE CHOICE QUESTION
30 sec • 1 pt
What is the main consideration when determining absolute extrema?
The x-values of the graph
The overall trend of the graph
The largest and smallest y-values used
The symmetry of the graph
7.
MULTIPLE CHOICE QUESTION
30 sec • 1 pt
Why is there no absolute maximum in the given graph example?
The y-values continue to increase indefinitely
The graph is symmetrical
The graph is a straight line
The graph has no x-intercepts
Access all questions and much more by creating a free account
Create resources
Host any resource
Get auto-graded reports
Continue with Google

Continue with Email
Continue with Classlink
Continue with Clever
or continue with
Microsoft
%20(1).png)
Apple
Others
Already have an account?
Popular Resources on Wayground

15 questions
Fractions on a Number Line
Quiz
•
3rd Grade
20 questions
Equivalent Fractions
Quiz
•
3rd Grade
25 questions
Multiplication Facts
Quiz
•
5th Grade
22 questions
fractions
Quiz
•
3rd Grade
20 questions
Main Idea and Details
Quiz
•
5th Grade
20 questions
Context Clues
Quiz
•
6th Grade
15 questions
Equivalent Fractions
Quiz
•
4th Grade
20 questions
Figurative Language Review
Quiz
•
6th Grade
Discover more resources for Mathematics
20 questions
Graphing Inequalities on a Number Line
Quiz
•
6th - 9th Grade
12 questions
Exponential Growth and Decay
Quiz
•
9th Grade
20 questions
Exponent Rules Review
Quiz
•
8th - 9th Grade
25 questions
Complementary and Supplementary Angles
Quiz
•
7th - 10th Grade
12 questions
Add and Subtract Polynomials
Quiz
•
9th - 12th Grade
13 questions
Model Exponential Growth and Decay Scenarios
Quiz
•
9th - 12th Grade
15 questions
Combine Like Terms and Distributive Property
Quiz
•
8th - 9th Grade
27 questions
7.2.3 Quadrilateral Properties
Quiz
•
9th - 12th Grade