Understanding Histograms and Bar Graphs
Interactive Video
•
Mathematics
•
6th - 7th Grade
•
Practice Problem
•
Hard

Thomas White
FREE Resource
Read more
10 questions
Show all answers
1.
MULTIPLE CHOICE QUESTION
30 sec • 1 pt
What is a histogram primarily used for?
Comparing two different data sets
Showing the total number of data points
Displaying the frequency of data within intervals
Listing data in alphabetical order
2.
MULTIPLE CHOICE QUESTION
30 sec • 1 pt
What is the first step in creating a histogram?
Labeling the axes
Organizing data into intervals
Calculating the mean of the data
Drawing the bars
3.
MULTIPLE CHOICE QUESTION
30 sec • 1 pt
How are the frequencies represented in a histogram?
By the height of the bars
By the width of the bars
By the number of bars
By the color of the bars
4.
MULTIPLE CHOICE QUESTION
30 sec • 1 pt
What is a key difference between a frequency table and a histogram?
Frequency tables are always more accurate
Frequency tables use colors to represent data
Histograms show data in intervals, frequency tables list frequencies
Histograms can only be used for qualitative data
5.
MULTIPLE CHOICE QUESTION
30 sec • 1 pt
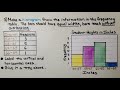
If three new students with heights between 62 and 65 inches join the class, what happens to the histogram?
A new bar is added
The intervals need to be recalculated
The bar for 62-65 inches increases in height
The histogram remains unchanged
6.
MULTIPLE CHOICE QUESTION
30 sec • 1 pt
What happens if a student with a height of 70 inches joins the class?
The existing bars are adjusted
A new interval and bar are added
The histogram is redrawn
The data is ignored
7.
MULTIPLE CHOICE QUESTION
30 sec • 1 pt
What is a common mistake people make when comparing histograms and bar graphs?
Confusing the order of data representation
Believing they both have the same purpose
Thinking they both show data in intervals
Assuming they both require the same data
Access all questions and much more by creating a free account
Create resources
Host any resource
Get auto-graded reports
Continue with Google

Continue with Email
Continue with Classlink
Continue with Clever
or continue with
Microsoft
%20(1).png)
Apple
Others
Already have an account?
