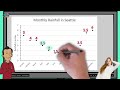
Rainfall Data Interpretation
Interactive Video
•
Mathematics
•
6th - 7th Grade
•
Practice Problem
•
Hard

Thomas White
FREE Resource
Read more
10 questions
Show all answers
1.
MULTIPLE CHOICE QUESTION
30 sec • 1 pt
What is the main topic of the video?
How to create a scatter plot
Interpreting data on a scatter plot
How to use a bar chart
The history of Seattle's rainfall
2.
MULTIPLE CHOICE QUESTION
30 sec • 1 pt
What does the horizontal axis on the scatter plot represent?
The temperature in Seattle
The number of rainy days
The months of the year
The amount of rainfall in inches
3.
MULTIPLE CHOICE QUESTION
30 sec • 1 pt
In the scatter plot, what does a dot represent?
A specific month and its rainfall
The temperature in Seattle
The average rainfall for the year
The total number of rainy days
4.
MULTIPLE CHOICE QUESTION
30 sec • 1 pt
How many months had less than four inches of rain?
Eight
Five
Six
Seven
5.
MULTIPLE CHOICE QUESTION
30 sec • 1 pt
What is the fraction of months with less than four inches of rain?
5/12
6/12
7/12
8/12
6.
MULTIPLE CHOICE QUESTION
30 sec • 1 pt
What is the denominator in the fraction representing months with less than four inches of rain?
7
12
4
3
7.
MULTIPLE CHOICE QUESTION
30 sec • 1 pt
How do you calculate the total rainfall for the year?
Multiply the rainfall of each month
Add the rainfall of each month
Divide the total rainfall by the number of months
Subtract the lowest rainfall from the highest
Access all questions and much more by creating a free account
Create resources
Host any resource
Get auto-graded reports
Continue with Google

Continue with Email
Continue with Microsoft
or continue with

%20(1).png)
Apple
Others
Already have an account?
