Understanding Number Lines and Dot Plots
Interactive Video
•
Mathematics
•
6th - 7th Grade
•
Practice Problem
•
Hard

Thomas White
FREE Resource
Read more
10 questions
Show all answers
1.
MULTIPLE CHOICE QUESTION
30 sec • 1 pt
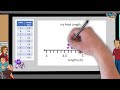
What is the range of the number line used for representing the iris petal measurements?
4 to 6
4 to 5.5
4 to 5
4.5 to 5.5
2.
MULTIPLE CHOICE QUESTION
30 sec • 1 pt
How many tenths are represented between each whole number on the number line?
Four tenths
Ten tenths
Five tenths
Two tenths
3.
MULTIPLE CHOICE QUESTION
30 sec • 1 pt
Where would you place a dot for a measurement of 4.9 on the number line?
At the 4th tick mark after 4
At the 9th tick mark after 4
At the 1st tick mark after 5
At the 5th tick mark after 4
4.
MULTIPLE CHOICE QUESTION
30 sec • 1 pt
What is the mode of the women's long jump competition data?
Seven
Six and one-half
Six and one-fourth
Six and three-fourths
5.
MULTIPLE CHOICE QUESTION
30 sec • 1 pt
How many dots should represent the mode in the correct Dot Plot?
Four dots
Three dots
Two dots
Five dots
6.
MULTIPLE CHOICE QUESTION
30 sec • 1 pt
Which tick mark represents six and three-fourths on the number line?
Third tick after six
First tick after six
Second tick after six
Fourth tick after six
7.
MULTIPLE CHOICE QUESTION
30 sec • 1 pt
Why was Dot Plot A eliminated from consideration?
It was missing data points
It had too many dots for the mode
It had too few dots for the mode
It had incorrect tick marks
Access all questions and much more by creating a free account
Create resources
Host any resource
Get auto-graded reports
Continue with Google

Continue with Email
Continue with Microsoft
or continue with

%20(1).png)
Apple
Others
Already have an account?
