Graphing Rocket Flight Concepts
Interactive Video
•
Physics
•
9th - 10th Grade
•
Practice Problem
•
Hard

Lucas Foster
FREE Resource
Read more
5 questions
Show all answers
1.
MULTIPLE CHOICE QUESTION
30 sec • 1 pt
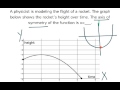
What does the y-axis represent in the graph modeling the rocket's flight?
Distance
Speed
Height
Time
2.
MULTIPLE CHOICE QUESTION
30 sec • 1 pt
What is the axis of symmetry in a graph?
The line where the graph turns
The lowest point of the graph
The point where the graph starts
The highest point of the graph
3.
MULTIPLE CHOICE QUESTION
30 sec • 1 pt
In the context of a graph, what is the x-coordinate of the vertex known as?
The y-intercept
The slope
The origin
The axis of symmetry
4.
MULTIPLE CHOICE QUESTION
30 sec • 1 pt
Where is the vertex located in the graph of the rocket's flight?
At the starting point
At the top point
At the ending point
At the bottom point
5.
MULTIPLE CHOICE QUESTION
30 sec • 1 pt
What does the axis of symmetry do to the graph?
Divides it into two unequal parts
Divides it into two equal parts
Marks the ending point
Marks the starting point
Access all questions and much more by creating a free account
Create resources
Host any resource
Get auto-graded reports
Continue with Google

Continue with Email
Continue with Classlink
Continue with Clever
or continue with
Microsoft
%20(1).png)
Apple
Others
Already have an account?
Popular Resources on Wayground

7 questions
History of Valentine's Day
Interactive video
•
4th Grade
15 questions
Fractions on a Number Line
Quiz
•
3rd Grade
20 questions
Equivalent Fractions
Quiz
•
3rd Grade
25 questions
Multiplication Facts
Quiz
•
5th Grade
22 questions
fractions
Quiz
•
3rd Grade
15 questions
Valentine's Day Trivia
Quiz
•
3rd Grade
20 questions
Main Idea and Details
Quiz
•
5th Grade
20 questions
Context Clues
Quiz
•
6th Grade
Discover more resources for Physics
10 questions
Exit Check 3.1 - Kepler's Laws
Quiz
•
9th Grade
10 questions
Exit Check 3.2 - Force of Gavity
Quiz
•
9th Grade
27 questions
Simple Machines and Mechanical Advantage Quiz
Quiz
•
9th Grade
20 questions
Unit 8 - Energy Test - 2025-2026
Quiz
•
9th - 12th Grade
19 questions
Generators, Motors, and Transformers
Quiz
•
8th Grade - University
24 questions
IPC Thermal Energy Test Corrections
Quiz
•
9th Grade
14 questions
Bill Nye Waves
Interactive video
•
9th - 12th Grade
20 questions
Ohm's Law
Quiz
•
9th Grade