Linear Functions and Scatter Plots
Interactive Video
•
Mathematics
•
9th - 10th Grade
•
Practice Problem
•
Hard

Aiden Montgomery
FREE Resource
Read more
5 questions
Show all answers
1.
MULTIPLE CHOICE QUESTION
30 sec • 1 pt
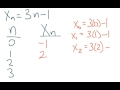
What is the explicit function given in the video?
x_n = 2n + 1
x_n = 3n - 1
x_n = n^2 - 1
x_n = 4n + 2
2.
MULTIPLE CHOICE QUESTION
30 sec • 1 pt
What is the x value when n = 0 using the function x_n = 3n - 1?
0
-1
1
3
3.
MULTIPLE CHOICE QUESTION
30 sec • 1 pt
Calculate the x value for n = 2 using the function x_n = 3n - 1.
5
7
6
4
4.
MULTIPLE CHOICE QUESTION
30 sec • 1 pt
Which of the following points is plotted on the scatter plot?
(2, 5)
(3, 9)
(0, 0)
(1, 1)
5.
MULTIPLE CHOICE QUESTION
30 sec • 1 pt
What does the scatter plot of the points indicate about the function?
It is not a function.
It is a quadratic function.
It is a linear function.
It is a constant function.
Access all questions and much more by creating a free account
Create resources
Host any resource
Get auto-graded reports
Continue with Google

Continue with Email
Continue with Classlink
Continue with Clever
or continue with
Microsoft
%20(1).png)
Apple
Others
Already have an account?
Popular Resources on Wayground

15 questions
Fractions on a Number Line
Quiz
•
3rd Grade
10 questions
Probability Practice
Quiz
•
4th Grade
15 questions
Probability on Number LIne
Quiz
•
4th Grade
20 questions
Equivalent Fractions
Quiz
•
3rd Grade
25 questions
Multiplication Facts
Quiz
•
5th Grade
22 questions
fractions
Quiz
•
3rd Grade
6 questions
Appropriate Chromebook Usage
Lesson
•
7th Grade
10 questions
Greek Bases tele and phon
Quiz
•
6th - 8th Grade
Discover more resources for Mathematics
23 questions
TSI Math Vocabulary
Quiz
•
10th - 12th Grade
15 questions
Graphing Inequalities
Quiz
•
7th - 9th Grade
20 questions
Graphing Inequalities on a Number Line
Quiz
•
6th - 9th Grade
15 questions
Combine Like Terms and Distributive Property
Quiz
•
8th - 9th Grade
10 questions
Plotting Points on a Coordinate Plane: Quadrant 1 Essentials
Interactive video
•
6th - 10th Grade
20 questions
Perfect Squares and Square Roots
Quiz
•
9th Grade
10 questions
Exploring Abiotic and Biotic Factors in Ecosystems
Interactive video
•
6th - 10th Grade
20 questions
Function or Not a Function
Quiz
•
8th - 9th Grade