Choosing the Best Y-Axis Scale
Interactive Video
•
Mathematics
•
6th - 7th Grade
•
Practice Problem
•
Hard

Olivia Brooks
FREE Resource
Read more
6 questions
Show all answers
1.
MULTIPLE CHOICE QUESTION
30 sec • 1 pt
What is the main task Fatima is trying to accomplish in the problem?
Calculating the distance between points.
Graphing points and choosing the best scale for the X-axis.
Finding the midpoint of the points.
Graphing points and choosing the best scale for the Y-axis.
2.
MULTIPLE CHOICE QUESTION
30 sec • 1 pt
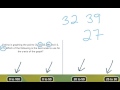
Which of the following is NOT a Y value from the points Fatima is graphing?
50
27
39
32
3.
MULTIPLE CHOICE QUESTION
30 sec • 1 pt
What is the largest Y value among the points Fatima is graphing?
32
39
27
50
4.
MULTIPLE CHOICE QUESTION
30 sec • 1 pt
Why is the scale 0 to 100 considered too large for the Y-axis?
Because it is the same as the X-axis scale.
Because it is smaller than the smallest Y value.
Because it is larger than the largest Y value.
Because it does not include all Y values.
5.
MULTIPLE CHOICE QUESTION
30 sec • 1 pt
Which scale option is eliminated because it cuts off some Y values?
0 to 100
0 to 50
25 to 30
20 to 50
6.
MULTIPLE CHOICE QUESTION
30 sec • 1 pt
Which scale is ultimately chosen as the best for the Y-axis?
0 to 100
0 to 50
20 to 50
25 to 30
Access all questions and much more by creating a free account
Create resources
Host any resource
Get auto-graded reports
Continue with Google

Continue with Email
Continue with Classlink
Continue with Clever
or continue with
Microsoft
%20(1).png)
Apple
Others
Already have an account?
