Understanding Quadratic Functions and Their Graphs
Interactive Video
•
Mathematics
•
9th - 10th Grade
•
Practice Problem
•
Hard

Lucas Foster
FREE Resource
Read more
6 questions
Show all answers
1.
MULTIPLE CHOICE QUESTION
30 sec • 1 pt
What is the general shape of a quadratic function like y = x^2?
A circular shape
A parabolic curve
A zigzag pattern
A straight line
2.
MULTIPLE CHOICE QUESTION
30 sec • 1 pt
Which characteristic is NOT associated with a quadratic function?
It is a type of polynomial function
It has a parabolic shape
It can be represented by y = x^2
It increases at a constant rate
3.
MULTIPLE CHOICE QUESTION
30 sec • 1 pt
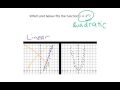
Why does the plot on the left not fit the function y = x^2?
It shows a linear trend
It has a parabolic shape
It is a circular plot
It is a zigzag pattern
4.
MULTIPLE CHOICE QUESTION
30 sec • 1 pt
What type of function best describes the plot on the left?
Logarithmic
Linear
Exponential
Quadratic
5.
MULTIPLE CHOICE QUESTION
30 sec • 1 pt
What makes the plot on the right a good fit for y = x^2?
It has a linear trend
It forms a parabolic curve
It is a circular plot
It is a zigzag pattern
6.
MULTIPLE CHOICE QUESTION
30 sec • 1 pt
Which plot is a better representation of a quadratic function?
The plot on the left
The plot on the right
Both plots equally
Neither plot
Access all questions and much more by creating a free account
Create resources
Host any resource
Get auto-graded reports
Continue with Google

Continue with Email
Continue with Classlink
Continue with Clever
or continue with
Microsoft
%20(1).png)
Apple
Others
Already have an account?
