Bacteria Population Growth Analysis
Interactive Video
•
Biology
•
9th - 10th Grade
•
Practice Problem
•
Hard

Lucas Foster
FREE Resource
Read more
8 questions
Show all answers
1.
MULTIPLE CHOICE QUESTION
30 sec • 1 pt
What is the main question being addressed in the video?
Calculating the growth rate of bacteria
Predicting the bacteria colony population after 8 hours
Understanding the concept of time
How to draw a scatter plot
2.
MULTIPLE CHOICE QUESTION
30 sec • 1 pt
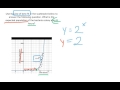
What does the blue line in the graph represent?
The error margin
The time axis
The line of best fit
The actual population of bacteria
3.
MULTIPLE CHOICE QUESTION
30 sec • 1 pt
What is the equation of the line of best fit used in the video?
Y = 2X
Y = X + 2
Y = 2^X
Y = X^2
4.
MULTIPLE CHOICE QUESTION
30 sec • 1 pt
How is the expected population of the bacteria colony determined at 8 hours?
By counting the bacteria manually
By using the equation Y = 2^X
By measuring the graph directly
By using a different equation
5.
MULTIPLE CHOICE QUESTION
30 sec • 1 pt
What is the expected population of the bacteria colony after 8 hours?
256
128
1024
512
6.
MULTIPLE CHOICE QUESTION
30 sec • 1 pt
Why is it difficult to estimate the population directly from the graph?
The graph is not labeled
The scale makes it hard to estimate
The graph is too small
The points are not clear
7.
MULTIPLE CHOICE QUESTION
30 sec • 1 pt
How is the solution verified against the graph?
By asking an expert
By checking if 256 is between 0 and 500 on the Y-axis
By recalculating the equation
By using a different graph
Access all questions and much more by creating a free account
Create resources
Host any resource
Get auto-graded reports
Continue with Google

Continue with Email
Continue with Classlink
Continue with Clever
or continue with
Microsoft
%20(1).png)
Apple
Others
Already have an account?
Popular Resources on Wayground

8 questions
Spartan Way - Classroom Responsible
Quiz
•
9th - 12th Grade
15 questions
Fractions on a Number Line
Quiz
•
3rd Grade
14 questions
Boundaries & Healthy Relationships
Lesson
•
6th - 8th Grade
20 questions
Equivalent Fractions
Quiz
•
3rd Grade
3 questions
Integrity and Your Health
Lesson
•
6th - 8th Grade
25 questions
Multiplication Facts
Quiz
•
5th Grade
9 questions
FOREST Perception
Lesson
•
KG
20 questions
Main Idea and Details
Quiz
•
5th Grade
Discover more resources for Biology
18 questions
Mendelian Genetics
Quiz
•
10th - 12th Grade
21 questions
Cell Cycle and mitosis
Quiz
•
9th - 10th Grade
20 questions
Food Chains and Food Webs
Quiz
•
7th - 12th Grade
10 questions
Exploring Food Webs and Energy Pyramids
Interactive video
•
6th - 10th Grade
20 questions
Plant structures and tropisms
Quiz
•
9th Grade
55 questions
Category2 SPRING 2026 - STAAR 2.0
Quiz
•
9th - 10th Grade
100 questions
*NEW Biology Benchmark 1 - STAAR 2.0
Quiz
•
9th Grade
72 questions
#Category 4 - STAAR 2.0
Quiz
•
9th - 10th Grade