Understanding Correlation in Scatterplots
Interactive Video
•
Mathematics
•
9th - 10th Grade
•
Practice Problem
•
Hard

Amelia Wright
FREE Resource
Read more
7 questions
Show all answers
1.
MULTIPLE CHOICE QUESTION
30 sec • 1 pt
What does a line of best fit with a positive slope indicate in a scatterplot?
A perfect correlation
No correlation
A positive correlation
A negative correlation
2.
MULTIPLE CHOICE QUESTION
30 sec • 1 pt
How can you identify a strong correlation in a scatterplot?
Points are closely aligned with the line of best fit
Points are randomly spread out
Points form a perfect circle
Points are evenly distributed
3.
MULTIPLE CHOICE QUESTION
30 sec • 1 pt
What characterizes a moderate correlation in a scatterplot?
Points are slightly spread out but show a trend
Points are randomly distributed
Points are very close to the line of best fit
Points form a straight line
4.
MULTIPLE CHOICE QUESTION
30 sec • 1 pt
In a scatterplot, what does it mean if the points are very spread out?
There is a strong correlation
There is no correlation
There is a moderate correlation
There is a weak correlation
5.
MULTIPLE CHOICE QUESTION
30 sec • 1 pt
What does it indicate if points in a scatterplot show no clear trend?
No correlation
A moderate correlation
A strong negative correlation
A strong positive correlation
6.
MULTIPLE CHOICE QUESTION
30 sec • 1 pt
Which of the following best describes a weak correlation?
Points are slightly spread out with no clear trend
Points are very spread out but show a trend
Points are randomly distributed
Points are tightly clustered around the line
7.
MULTIPLE CHOICE QUESTION
30 sec • 1 pt
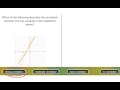
What is the relationship between the spread of points and the strength of correlation?
The more spread out the points, the stronger the correlation
The closer the points to the line, the weaker the correlation
The closer the points to the line, the stronger the correlation
The spread of points does not affect the correlation
Access all questions and much more by creating a free account
Create resources
Host any resource
Get auto-graded reports
Continue with Google

Continue with Email
Continue with Classlink
Continue with Clever
or continue with
Microsoft
%20(1).png)
Apple
Others
Already have an account?
Popular Resources on Wayground

15 questions
Fractions on a Number Line
Quiz
•
3rd Grade
10 questions
Probability Practice
Quiz
•
4th Grade
15 questions
Probability on Number LIne
Quiz
•
4th Grade
20 questions
Equivalent Fractions
Quiz
•
3rd Grade
25 questions
Multiplication Facts
Quiz
•
5th Grade
22 questions
fractions
Quiz
•
3rd Grade
6 questions
Appropriate Chromebook Usage
Lesson
•
7th Grade
10 questions
Greek Bases tele and phon
Quiz
•
6th - 8th Grade
Discover more resources for Mathematics
23 questions
TSI Math Vocabulary
Quiz
•
10th - 12th Grade
15 questions
Graphing Inequalities
Quiz
•
7th - 9th Grade
20 questions
Graphing Inequalities on a Number Line
Quiz
•
6th - 9th Grade
15 questions
Combine Like Terms and Distributive Property
Quiz
•
8th - 9th Grade
10 questions
Plotting Points on a Coordinate Plane: Quadrant 1 Essentials
Interactive video
•
6th - 10th Grade
20 questions
Perfect Squares and Square Roots
Quiz
•
9th Grade
10 questions
Exploring Abiotic and Biotic Factors in Ecosystems
Interactive video
•
6th - 10th Grade
20 questions
Function or Not a Function
Quiz
•
8th - 9th Grade