Creating and Analyzing Histograms
Interactive Video
•
Mathematics
•
6th - 7th Grade
•
Practice Problem
•
Hard

Amelia Wright
FREE Resource
Read more
10 questions
Show all answers
1.
MULTIPLE CHOICE QUESTION
30 sec • 1 pt
What is the first step in creating a histogram?
Deciding the title of the histogram
Identifying the data range
Selecting the type of graph
Choosing the color of the bars
2.
MULTIPLE CHOICE QUESTION
30 sec • 1 pt
Why is it important to have a little room on either side of the histogram range?
To make the graph look more balanced
To ensure all data points are included
To make the graph easier to read
To allow for future data additions
3.
MULTIPLE CHOICE QUESTION
30 sec • 1 pt
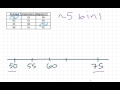
How many bins are typically recommended for a histogram?
Three
Five
Ten
Fifteen
4.
MULTIPLE CHOICE QUESTION
30 sec • 1 pt
What is the purpose of determining the scale for a histogram?
To decide the color of the bars
To determine the increment for each tick mark
To choose the title of the graph
To select the type of data to display
5.
MULTIPLE CHOICE QUESTION
30 sec • 1 pt
What is the width of each bin in the example provided?
Ten
Seven
Five
Three
6.
MULTIPLE CHOICE QUESTION
30 sec • 1 pt
Why is it important to ensure each bin has an appropriate width?
To allow for more data points
To ensure data is evenly distributed
To make the graph easier to read
To make the graph colorful
7.
MULTIPLE CHOICE QUESTION
30 sec • 1 pt
What should you do if you notice a data point was missed when placing data into bins?
Ignore it
Start over
Adjust the bin height
Change the bin width
Access all questions and much more by creating a free account
Create resources
Host any resource
Get auto-graded reports
Continue with Google

Continue with Email
Continue with Classlink
Continue with Clever
or continue with
Microsoft
%20(1).png)
Apple
Others
Already have an account?
