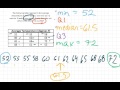
Box Plot and Quartiles Concepts
Interactive Video
•
Mathematics
•
9th - 10th Grade
•
Practice Problem
•
Hard

Amelia Wright
FREE Resource
Read more
10 questions
Show all answers
1.
MULTIPLE CHOICE QUESTION
30 sec • 1 pt
What are the five key values needed to create a box plot?
Minimum, Maximum, Mean, Mode, Range
First Quartile, Median, Third Quartile, Mean, Maximum
Minimum, First Quartile, Median, Third Quartile, Maximum
Minimum, Median, Mode, Range, Maximum
2.
MULTIPLE CHOICE QUESTION
30 sec • 1 pt
What is the first step in creating a box plot from a data set?
Calculate the mean of the data set
Order the data from greatest to least
Order the data from least to greatest
Identify the mode of the data set
3.
MULTIPLE CHOICE QUESTION
30 sec • 1 pt
How is the median of a data set determined when there is an even number of values?
By choosing the lowest number
By selecting the middle number
By taking the average of the two middle numbers
By choosing the highest number
4.
MULTIPLE CHOICE QUESTION
30 sec • 1 pt
What is the first quartile in a data set?
The lowest value in the data set
The middle value of the entire data set
The middle value of the lower half of the data set
The highest value in the data set
5.
MULTIPLE CHOICE QUESTION
30 sec • 1 pt
How is the first quartile calculated if the lower half of the data set has an even number of values?
By selecting the highest value
By averaging the two middle values
By selecting the lowest value
By choosing the first value
6.
MULTIPLE CHOICE QUESTION
30 sec • 1 pt
What is the third quartile in a data set?
The highest value in the data set
The middle value of the entire data set
The lowest value in the data set
The middle value of the upper half of the data set
7.
MULTIPLE CHOICE QUESTION
30 sec • 1 pt
How is the third quartile calculated if the upper half of the data set has an even number of values?
By selecting the lowest value
By averaging the two middle values
By selecting the highest value
By choosing the last value
Access all questions and much more by creating a free account
Create resources
Host any resource
Get auto-graded reports
Continue with Google

Continue with Email
Continue with Classlink
Continue with Clever
or continue with
Microsoft
%20(1).png)
Apple
Others
Already have an account?
Popular Resources on Wayground

15 questions
Fractions on a Number Line
Quiz
•
3rd Grade
20 questions
Equivalent Fractions
Quiz
•
3rd Grade
25 questions
Multiplication Facts
Quiz
•
5th Grade
54 questions
Analyzing Line Graphs & Tables
Quiz
•
4th Grade
22 questions
fractions
Quiz
•
3rd Grade
20 questions
Main Idea and Details
Quiz
•
5th Grade
20 questions
Context Clues
Quiz
•
6th Grade
15 questions
Equivalent Fractions
Quiz
•
4th Grade
Discover more resources for Mathematics
20 questions
Graphing Inequalities on a Number Line
Quiz
•
6th - 9th Grade
18 questions
SAT Prep: Ratios, Proportions, & Percents
Quiz
•
9th - 10th Grade
12 questions
Exponential Growth and Decay
Quiz
•
9th Grade
12 questions
Parallel Lines Cut by a Transversal
Quiz
•
10th Grade
12 questions
Add and Subtract Polynomials
Quiz
•
9th - 12th Grade
15 questions
Combine Like Terms and Distributive Property
Quiz
•
8th - 9th Grade
20 questions
Function or Not a Function
Quiz
•
8th - 9th Grade
10 questions
Elijah McCoy: Innovations and Impact in Black History
Interactive video
•
6th - 10th Grade