Understanding Rates of Change
Interactive Video
•
Mathematics
•
6th - 7th Grade
•
Practice Problem
•
Hard

Olivia Brooks
FREE Resource
Read more
5 questions
Show all answers
1.
MULTIPLE CHOICE QUESTION
30 sec • 1 pt
What is the primary focus of understanding rates of change?
To calculate the distance between two points
To determine the speed of a vehicle
To understand how prices can vary or remain constant
To measure the height of a building
2.
MULTIPLE CHOICE QUESTION
30 sec • 1 pt
In a constant rate of change, how does the price of each item behave?
The price remains the same for each item
The price decreases with each item
The price increases with each item
The price is random for each item
3.
MULTIPLE CHOICE QUESTION
30 sec • 1 pt
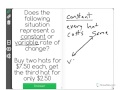
If you buy two hats for $7.50 each, what would be the total cost in a constant rate scenario?
$22.50
$15.00
$10.00
$7.50
4.
MULTIPLE CHOICE QUESTION
30 sec • 1 pt
What happens to the price of the third hat in a variable rate of change scenario?
It increases compared to the first two
It is free
It remains the same as the first two
It decreases compared to the first two
5.
MULTIPLE CHOICE QUESTION
30 sec • 1 pt
How is a variable rate of change represented on a graph?
As a curved line
As a straight line
As a zigzag line
As a dotted line
Access all questions and much more by creating a free account
Create resources
Host any resource
Get auto-graded reports
Continue with Google

Continue with Email
Continue with Classlink
Continue with Clever
or continue with
Microsoft
%20(1).png)
Apple
Others
Already have an account?
