Understanding Dot Plots Concepts
Interactive Video
•
Mathematics
•
4th - 5th Grade
•
Practice Problem
•
Hard

Olivia Brooks
FREE Resource
Read more
5 questions
Show all answers
1.
MULTIPLE CHOICE QUESTION
30 sec • 1 pt
What is the first step in creating a Dot Plot?
Draw a bar graph
Count the total number of data points
Start with a number line using the least value
Identify the median value
2.
MULTIPLE CHOICE QUESTION
30 sec • 1 pt
How do you determine the range of the number line in a Dot Plot?
By using the sum of all data points
By using the most frequent value
By using the least and greatest values in the data
By using the average of the data set
3.
MULTIPLE CHOICE QUESTION
30 sec • 1 pt
What does each dot represent in a Dot Plot?
The total number of data points
A group of data points
The average of the data set
A single data point
4.
MULTIPLE CHOICE QUESTION
30 sec • 1 pt
How do you place dots on a Dot Plot?
Randomly across the number line
In a separate chart
Only above the median value
Above the number that corresponds to each data point
5.
MULTIPLE CHOICE QUESTION
30 sec • 1 pt
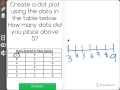
How many dots are placed above the number five in the given Dot Plot?
Seven
Six
Five
Four
Access all questions and much more by creating a free account
Create resources
Host any resource
Get auto-graded reports
Continue with Google

Continue with Email
Continue with Microsoft
or continue with

%20(1).png)
Apple
Others
Already have an account?
