Box Plot and Quartiles Concepts
Interactive Video
•
Mathematics
•
9th - 10th Grade
•
Practice Problem
•
Hard

Olivia Brooks
FREE Resource
Read more
7 questions
Show all answers
1.
MULTIPLE CHOICE QUESTION
30 sec • 1 pt
What does the smallest value in a box plot represent?
The first quartile
The maximum
The median
The minimum
2.
MULTIPLE CHOICE QUESTION
30 sec • 1 pt
In a box plot, what is the term for the start of the box on the left?
The median
The first quartile
The third quartile
The maximum
3.
MULTIPLE CHOICE QUESTION
30 sec • 1 pt
How is the first quartile (Q1) determined in a box plot?
It is the smallest value
It is the value at the start of the box
It is the value at the end of the box
It is the middle value of the data set
4.
MULTIPLE CHOICE QUESTION
30 sec • 1 pt
What is the value of the third quartile (Q3) in the given data set?
16.5
20
23
27
5.
MULTIPLE CHOICE QUESTION
30 sec • 1 pt
What does the middle line in a box plot represent?
The maximum
The first quartile
The minimum
The median
6.
MULTIPLE CHOICE QUESTION
30 sec • 1 pt
What is the maximum value in the given box plot?
16.5
27
20
23
7.
MULTIPLE CHOICE QUESTION
30 sec • 1 pt
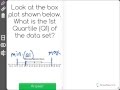
What is the value of the first quartile (Q1) in this data set?
13
16.5
20
23
Access all questions and much more by creating a free account
Create resources
Host any resource
Get auto-graded reports
Continue with Google

Continue with Email
Continue with Classlink
Continue with Clever
or continue with
Microsoft
%20(1).png)
Apple
Others
Already have an account?
