Comparing Line and Dot Plots
Interactive Video
•
Mathematics
•
6th - 7th Grade
•
Practice Problem
•
Hard

Liam Anderson
FREE Resource
Read more
6 questions
Show all answers
1.
MULTIPLE CHOICE QUESTION
30 sec • 1 pt
What is the first step in comparing a line plot and a dot plot?
Counting the total number of data points
Checking the number of marks above each value
Calculating the mean of the data
Identifying the range of the data
2.
MULTIPLE CHOICE QUESTION
30 sec • 1 pt
In the line plot, how many marks are placed above the value 0?
3
2
1
4
3.
MULTIPLE CHOICE QUESTION
30 sec • 1 pt
What discrepancy is noted for the number 1 between the line plot and the dot plot?
Line plot has 2 marks, dot plot has 1
Line plot has 1 mark, dot plot has 2
Line plot has 0 marks, dot plot has 3
Line plot has 3 marks, dot plot has 0
4.
MULTIPLE CHOICE QUESTION
30 sec • 1 pt
How many marks does the number 4 have in the dot plot?
1
3
0
2
5.
MULTIPLE CHOICE QUESTION
30 sec • 1 pt
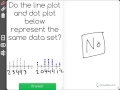
What is the conclusion about the data sets represented by the line plot and the dot plot?
They have the same range
They represent different data sets
They represent the same data set
They have the same number of data points
6.
MULTIPLE CHOICE QUESTION
30 sec • 1 pt
Which plot has a mark for the number 5?
Only the line plot
Neither plot
Only the dot plot
Both plots
Access all questions and much more by creating a free account
Create resources
Host any resource
Get auto-graded reports
Continue with Google

Continue with Email
Continue with Classlink
Continue with Clever
or continue with
Microsoft
%20(1).png)
Apple
Others
Already have an account?
Similar Resources on Wayground
Popular Resources on Wayground

15 questions
Fractions on a Number Line
Quiz
•
3rd Grade
20 questions
Equivalent Fractions
Quiz
•
3rd Grade
25 questions
Multiplication Facts
Quiz
•
5th Grade
29 questions
Alg. 1 Section 5.1 Coordinate Plane
Quiz
•
9th Grade
22 questions
fractions
Quiz
•
3rd Grade
11 questions
FOREST Effective communication
Lesson
•
KG
20 questions
Main Idea and Details
Quiz
•
5th Grade
20 questions
Context Clues
Quiz
•
6th Grade
Discover more resources for Mathematics
36 questions
6th Grade Math STAAR Review
Quiz
•
6th Grade
14 questions
Volume of rectangular prisms
Quiz
•
7th Grade
20 questions
Graphing Inequalities on a Number Line
Quiz
•
6th - 9th Grade
23 questions
Solve and Graph Inequalities
Quiz
•
6th Grade
15 questions
Distributive Property & Review
Quiz
•
6th Grade
10 questions
Mean, Median, Mode, and Range
Quiz
•
7th Grade
17 questions
Area of a parallelogram
Quiz
•
6th Grade
23 questions
Mean median mode and range
Quiz
•
7th Grade