Graphing Distance and Time Concepts
Interactive Video
•
Mathematics
•
6th - 7th Grade
•
Practice Problem
•
Hard

Sophia Harris
FREE Resource
Read more
7 questions
Show all answers
1.
MULTIPLE CHOICE QUESTION
30 sec • 1 pt
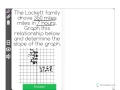
What is the total distance traveled by the Locket family?
300 miles
400 miles
350 miles
250 miles
2.
MULTIPLE CHOICE QUESTION
30 sec • 1 pt
Which axis is used to represent time in the graph?
Z-axis
Y-axis
X-axis
W-axis
3.
MULTIPLE CHOICE QUESTION
30 sec • 1 pt
What scale is used for the distance axis in the graph?
Counting by 200s
Counting by 10s
Counting by 100s
Counting by 50s
4.
MULTIPLE CHOICE QUESTION
30 sec • 1 pt
Where is the point representing 7 hours and 350 miles plotted?
At the origin
At (7, 350)
At (350, 7)
At (0, 0)
5.
MULTIPLE CHOICE QUESTION
30 sec • 1 pt
What is the slope of the graph?
100
25
50
75
6.
MULTIPLE CHOICE QUESTION
30 sec • 1 pt
How is the slope of a graph defined?
Run over rise
Time over distance
Rise over run
Distance over time
7.
MULTIPLE CHOICE QUESTION
30 sec • 1 pt
What does the point (0, 0) represent in this context?
Start of the journey
End of the journey
Midpoint of the journey
No significance
Access all questions and much more by creating a free account
Create resources
Host any resource
Get auto-graded reports
Continue with Google

Continue with Email
Continue with Microsoft
or continue with

%20(1).png)
Apple
Others
Already have an account?
