Understanding Line Plots and Graphs
Interactive Video
•
Mathematics
•
3rd - 4th Grade
•
Practice Problem
•
Hard

Lucas Foster
FREE Resource
Read more
10 questions
Show all answers
1.
MULTIPLE CHOICE QUESTION
30 sec • 1 pt
What is the primary purpose of a line plot?
To compare different categories
To show relationships between variables
To organize and display information easily
To display data using bars
2.
MULTIPLE CHOICE QUESTION
30 sec • 1 pt
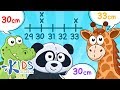
In the example of stuffed animals, what does each 'X' on the line plot represent?
A group of animals
The total number of animals
The average height of animals
One animal
3.
MULTIPLE CHOICE QUESTION
30 sec • 1 pt
Which of the following is NOT a characteristic of a line plot?
Numbers on the bottom
Each mark represents one item
Colorful bars
X's or dots above numbers
4.
MULTIPLE CHOICE QUESTION
30 sec • 1 pt
How can you identify a bar graph?
It uses dots to represent data
It has numbers on the bottom and X's above
It has pictures instead of numbers
It uses colorful bars to display data
5.
MULTIPLE CHOICE QUESTION
30 sec • 1 pt
What is the first step in answering questions using a line plot?
Count the number of items
Read the questions first
Look at the line plot to understand it
Guess the answers
6.
MULTIPLE CHOICE QUESTION
30 sec • 1 pt
If a line plot shows five dots above the number 18, what does this indicate?
There are five items of 18 units
The average is 18
There are 18 items
The total is 18
7.
MULTIPLE CHOICE QUESTION
30 sec • 1 pt
What is the length of the longest pencils in the example line plot?
24 cm
22 cm
20 cm
18 cm
Access all questions and much more by creating a free account
Create resources
Host any resource
Get auto-graded reports
Continue with Google

Continue with Email
Continue with Microsoft
or continue with

%20(1).png)
Apple
Others
Already have an account?
