Understanding Trend Lines and Predictions
Interactive Video
•
Mathematics
•
8th Grade
•
Practice Problem
•
Hard

Thomas White
FREE Resource
Read more
15 questions
Show all answers
1.
MULTIPLE CHOICE QUESTION
30 sec • 1 pt
What is the primary purpose of using trend lines in data analysis?
To predict future data points
To make data more complex
To create a decorative pattern
To eliminate outliers
2.
MULTIPLE CHOICE QUESTION
30 sec • 1 pt
In which quadrant are we focusing on when analyzing positive values?
Quadrant One
Quadrant Three
Quadrant Four
Quadrant Two
3.
MULTIPLE CHOICE QUESTION
30 sec • 1 pt
What is the first step in identifying a pattern in data?
Drawing random lines
Looking for a consistent trend
Ignoring all data points
Focusing on negative values
4.
MULTIPLE CHOICE QUESTION
30 sec • 1 pt
When drawing a trend line, what should you ensure about the data points?
Equal number of points above and below the line
Points should form a circle
All points should be above the line
All points should be below the line
5.
MULTIPLE CHOICE QUESTION
30 sec • 1 pt
How can trend lines be used once they are drawn?
To make predictions for unknown values
To erase data points
To change the data set
To create a new graph
6.
MULTIPLE CHOICE QUESTION
30 sec • 1 pt
What type of line should be avoided when drawing trend lines?
Straight line
Dashed line
Wobbly line
Colored line
7.
MULTIPLE CHOICE QUESTION
30 sec • 1 pt
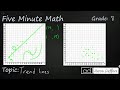
If X is 14, what is the predicted Y value using the trend line?
12.5
14.5
16.5
18.5
Access all questions and much more by creating a free account
Create resources
Host any resource
Get auto-graded reports
Continue with Google

Continue with Email
Continue with Classlink
Continue with Clever
or continue with
Microsoft
%20(1).png)
Apple
Others
Already have an account?
Popular Resources on Wayground

15 questions
Fractions on a Number Line
Quiz
•
3rd Grade
20 questions
Equivalent Fractions
Quiz
•
3rd Grade
25 questions
Multiplication Facts
Quiz
•
5th Grade
29 questions
Alg. 1 Section 5.1 Coordinate Plane
Quiz
•
9th Grade
22 questions
fractions
Quiz
•
3rd Grade
11 questions
FOREST Effective communication
Lesson
•
KG
20 questions
Main Idea and Details
Quiz
•
5th Grade
20 questions
Context Clues
Quiz
•
6th Grade
Discover more resources for Mathematics
14 questions
finding slope from a graph
Quiz
•
8th Grade
20 questions
Graphing Inequalities on a Number Line
Quiz
•
6th - 9th Grade
8 questions
8th U6L1: Organizing Data
Quiz
•
8th Grade
20 questions
Slope from a Graph
Quiz
•
8th Grade
12 questions
8th U5 Test Review: Functions & Volume
Quiz
•
8th Grade
20 questions
Slope Intercept Form
Quiz
•
7th - 8th Grade
20 questions
Angle Relationships
Quiz
•
6th - 8th Grade
14 questions
Estimate and Classify Real Numbers
Quiz
•
8th Grade