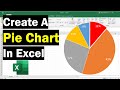
Creating and Customizing Pie Charts
Interactive Video
•
Computers
•
9th - 10th Grade
•
Practice Problem
•
Hard

Thomas White
FREE Resource
Read more
14 questions
Show all answers
1.
MULTIPLE CHOICE QUESTION
30 sec • 1 pt
What is the main purpose of this video tutorial?
To explore advanced Excel formulas
To learn how to create a bar chart in Excel
To understand how to use Excel for data entry
To create and customize a pie chart in Excel
2.
MULTIPLE CHOICE QUESTION
30 sec • 1 pt
What is the range of scores in the example data used in the tutorial?
A to E
1 to 5
0 to 100
A to F
3.
MULTIPLE CHOICE QUESTION
30 sec • 1 pt
What is the first step in creating a pie chart in Excel?
Choose a chart style
Format the chart area
Insert a new worksheet
Select the data to be plotted
4.
MULTIPLE CHOICE QUESTION
30 sec • 1 pt
Which type of pie chart is used in the tutorial example?
3D Pie Chart
Bar Chart
Donut Chart
2D Pie Chart
5.
MULTIPLE CHOICE QUESTION
30 sec • 1 pt
What is the simplest way to add data labels to a pie chart in Excel?
Use the 'Insert' menu
Right-click the chart and select 'Add Labels'
Click the plus icon on the chart
Use the 'Format' menu
6.
MULTIPLE CHOICE QUESTION
30 sec • 1 pt
Why is it important to display data labels as percentages in a pie chart?
To add more data points
To simplify the chart creation process
To accurately represent data proportions
To make the chart look more colorful
7.
MULTIPLE CHOICE QUESTION
30 sec • 1 pt
How can you change the position of data labels in a pie chart?
By dragging them manually
By resizing the chart
Using the 'Format Data Labels' sidebar
By changing the chart type
Access all questions and much more by creating a free account
Create resources
Host any resource
Get auto-graded reports
Continue with Google

Continue with Email
Continue with Classlink
Continue with Clever
or continue with
Microsoft
%20(1).png)
Apple
Others
Already have an account?
Popular Resources on Wayground

15 questions
Fractions on a Number Line
Quiz
•
3rd Grade
20 questions
Equivalent Fractions
Quiz
•
3rd Grade
25 questions
Multiplication Facts
Quiz
•
5th Grade
54 questions
Analyzing Line Graphs & Tables
Quiz
•
4th Grade
22 questions
fractions
Quiz
•
3rd Grade
20 questions
Main Idea and Details
Quiz
•
5th Grade
20 questions
Context Clues
Quiz
•
6th Grade
15 questions
Equivalent Fractions
Quiz
•
4th Grade