Understanding Venn Diagrams and Data
Interactive Video
•
Mathematics
•
3rd - 4th Grade
•
Practice Problem
•
Hard

Thomas White
FREE Resource
Read more
15 questions
Show all answers
1.
MULTIPLE CHOICE QUESTION
30 sec • 1 pt
What is the main topic of this lesson?
Understanding data using pie charts
Understanding data using line graphs
Understanding data using Venn diagrams
Understanding data using bar graphs
2.
MULTIPLE CHOICE QUESTION
30 sec • 1 pt
What did Ivan's mom buy him for his birthday?
Green colored gifts and toys
Yellow colored gifts and candies
Blue colored gifts and vegetables
Red colored gifts and some fruits
3.
MULTIPLE CHOICE QUESTION
30 sec • 1 pt
How did Ivan decide to organize his birthday gifts?
Using a Venn diagram
Using a pie chart
Using a line graph
Using a bar graph
4.
MULTIPLE CHOICE QUESTION
30 sec • 1 pt
What is the first step Ivan took to create his Venn diagram?
He drew a rectangle
He drew a triangle
He drew a square
He drew a circle for red gifts
5.
MULTIPLE CHOICE QUESTION
30 sec • 1 pt
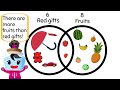
What does the overlapping part of the circles in a Venn diagram represent?
Items that belong to only one category
Items that are not part of the data
Items that belong to both categories
Items that belong to neither category
6.
MULTIPLE CHOICE QUESTION
30 sec • 1 pt
Which items go into the overlapping part of the Venn diagram?
Items that are neither red nor fruits
Items that are only red
Items that are only fruits
Items that are both red and fruits
7.
MULTIPLE CHOICE QUESTION
30 sec • 1 pt
In the context of Venn diagrams, what is data?
Only graphical representations
Only textual information
Any item or object we want to list down or record
Only numerical values
Access all questions and much more by creating a free account
Create resources
Host any resource
Get auto-graded reports
Continue with Google

Continue with Email
Continue with Microsoft
or continue with

%20(1).png)
Apple
Others
Already have an account?
