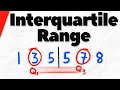
Interquartile Range and Data Analysis
Interactive Video
•
Mathematics
•
6th - 7th Grade
•
Practice Problem
•
Hard

Thomas White
FREE Resource
Read more
19 questions
Show all answers
1.
MULTIPLE CHOICE QUESTION
30 sec • 1 pt
What is the main topic discussed in the video?
Standard deviation
Interquartile range
Mean calculation
Probability
2.
MULTIPLE CHOICE QUESTION
30 sec • 1 pt
How is the interquartile range calculated?
By dividing the third quartile by the first quartile
By adding the first and third quartiles
By subtracting the first quartile from the third quartile
By multiplying the first and third quartiles
3.
MULTIPLE CHOICE QUESTION
30 sec • 1 pt
In the example, what event is used to demonstrate the interquartile range?
A chess tournament
A pie-eating contest
A marathon
A hot dog eating contest
4.
MULTIPLE CHOICE QUESTION
30 sec • 1 pt
What is the first step in analyzing the data set?
Ordering the data from least to greatest
Finding the mean
Finding the mode
Calculating the standard deviation
5.
MULTIPLE CHOICE QUESTION
30 sec • 1 pt
How do you find the median in a data set?
By adding all numbers and dividing by the count
By finding the middle number in an ordered set
By subtracting the smallest number from the largest
By identifying the most frequent number
6.
MULTIPLE CHOICE QUESTION
30 sec • 1 pt
What should you do if you have an odd number of data points when finding the median?
Use the middle data point as the median
Ignore the last data point
Average the first and last data points
Add an extra data point
7.
MULTIPLE CHOICE QUESTION
30 sec • 1 pt
What is the significance of ordering data from least to greatest?
It helps in finding the mean
It is necessary for calculating the mode
It is required for finding the median and quartiles
It simplifies the calculation of variance
Access all questions and much more by creating a free account
Create resources
Host any resource
Get auto-graded reports
Continue with Google

Continue with Email
Continue with Microsoft
or continue with

%20(1).png)
Apple
Others
Already have an account?
