Statistics Concepts and Calculations
Interactive Video
•
Mathematics
•
6th - 7th Grade
•
Practice Problem
•
Hard

Thomas White
FREE Resource
Read more
21 questions
Show all answers
1.
MULTIPLE CHOICE QUESTION
30 sec • 1 pt
What are the main topics covered in this chapter?
Mean and median
Standard deviation and histograms
Probability and permutations
Mean absolute deviation and box plots
2.
MULTIPLE CHOICE QUESTION
30 sec • 1 pt
How is the mean of a data set calculated?
By finding the most frequent value
By subtracting the smallest value from the largest
By adding all data points and dividing by the number of points
By finding the middle value
3.
MULTIPLE CHOICE QUESTION
30 sec • 1 pt
What is the median of a data set?
The average of all data points
The difference between the largest and smallest values
The middle value of the data set
The most frequently occurring value
4.
MULTIPLE CHOICE QUESTION
30 sec • 1 pt
What does the range of a data set represent?
The sum of all data points
The middle value of the data set
The most frequently occurring value
The difference between the largest and smallest values
5.
MULTIPLE CHOICE QUESTION
30 sec • 1 pt
What is the first step in calculating the mean absolute deviation?
Finding the range
Finding the mean
Finding the mode
Finding the median
6.
MULTIPLE CHOICE QUESTION
30 sec • 1 pt
What is the mean absolute deviation (MAD)?
The average of the absolute deviations from the mean
The middle value of the data set
The difference between the largest and smallest values
The most frequently occurring value
7.
MULTIPLE CHOICE QUESTION
30 sec • 1 pt
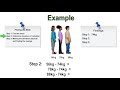
In the example provided, what is the mean of the data set 56, 78, and 88?
74
56
78
88
Access all questions and much more by creating a free account
Create resources
Host any resource
Get auto-graded reports
Continue with Google

Continue with Email
Continue with Classlink
Continue with Clever
or continue with
Microsoft
%20(1).png)
Apple
Others
Already have an account?
