Butterfly Study Data Analysis Concepts
Interactive Video
•
Biology
•
9th - 10th Grade
•
Practice Problem
•
Hard

Thomas White
FREE Resource
Read more
15 questions
Show all answers
1.
MULTIPLE CHOICE QUESTION
30 sec • 1 pt
What is the primary focus of the butterfly study mentioned in the video?
Counting the number of butterflies in a sanctuary
Studying the migration patterns of birds
Analyzing the growth of plants
Observing the behavior of insects
2.
MULTIPLE CHOICE QUESTION
30 sec • 1 pt
In the context of the butterfly study, what does the y-value represent?
The temperature of the sanctuary
The migration distance of butterflies
The number of butterflies observed
The number of weeks since the beginning of the year
3.
MULTIPLE CHOICE QUESTION
30 sec • 1 pt
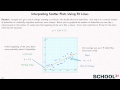
What is the equation of the fit line used in the butterfly study?
y = 2.0x + 6.0
y = 1.9x + 5.2
y = 3.0x + 4.0
y = 2.5x + 3.1
4.
MULTIPLE CHOICE QUESTION
30 sec • 1 pt
What is the role of the x-value in the butterfly study's graph?
It represents the number of butterflies
It indicates the number of weeks
It shows the migration distance
It measures the temperature
5.
MULTIPLE CHOICE QUESTION
30 sec • 1 pt
What does the y-intercept of 5.2 indicate in the butterfly study?
The total number of butterflies observed
The average number of butterflies per week
The number of butterflies at the start of the study
The number of weeks in the study
6.
MULTIPLE CHOICE QUESTION
30 sec • 1 pt
In the equation y = mx + b, what does 'b' represent?
The average rate of change
The slope of the line
The y-intercept
The x-intercept
7.
MULTIPLE CHOICE QUESTION
30 sec • 1 pt
How does the y-intercept relate to the starting point of the study?
It measures the distance of migration
It predicts future butterfly numbers
It indicates the initial number of butterflies
It shows the number of weeks completed
Access all questions and much more by creating a free account
Create resources
Host any resource
Get auto-graded reports
Continue with Google

Continue with Email
Continue with Classlink
Continue with Clever
or continue with
Microsoft
%20(1).png)
Apple
Others
Already have an account?
Popular Resources on Wayground

15 questions
Fractions on a Number Line
Quiz
•
3rd Grade
20 questions
Equivalent Fractions
Quiz
•
3rd Grade
25 questions
Multiplication Facts
Quiz
•
5th Grade
22 questions
fractions
Quiz
•
3rd Grade
20 questions
Main Idea and Details
Quiz
•
5th Grade
20 questions
Context Clues
Quiz
•
6th Grade
15 questions
Equivalent Fractions
Quiz
•
4th Grade
20 questions
Figurative Language Review
Quiz
•
6th Grade
Discover more resources for Biology
20 questions
Cell Organelles
Quiz
•
10th Grade
20 questions
Cell Organelles
Quiz
•
9th Grade
20 questions
DNA & Protein Synthesis
Quiz
•
9th Grade
7 questions
Amoeba Sisters Dihybrid Cross Punnett Square
Interactive video
•
9th - 12th Grade
25 questions
photosynthesis and cellular respiration
Quiz
•
9th Grade
20 questions
Human Body Systems
Quiz
•
9th Grade
19 questions
Natural Selection
Quiz
•
9th Grade
20 questions
Pedigree Practice
Quiz
•
9th Grade