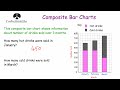
Understanding Composite Bar Charts
Interactive Video
•
Mathematics
•
6th - 7th Grade
•
Practice Problem
•
Hard

Thomas White
FREE Resource
Read more
10 questions
Show all answers
1.
MULTIPLE CHOICE QUESTION
30 sec • 1 pt
What is the primary purpose of a composite bar chart?
To highlight the highest value in a dataset
To show data for a single category
To compare multiple categories within the same chart
To display trends over time
2.
MULTIPLE CHOICE QUESTION
30 sec • 1 pt
How does a composite bar chart differ from a regular bar chart?
It uses different colors for each bar
It includes multiple categories stacked in one bar
It only shows data for one category
It is always horizontal
3.
MULTIPLE CHOICE QUESTION
30 sec • 1 pt
In a composite bar chart, what does each color or pattern represent?
A different category
A different chart type
A different data source
A different time period
4.
MULTIPLE CHOICE QUESTION
30 sec • 1 pt
What information does the key in a composite bar chart provide?
The average value of the data
The total number of bars
The categories represented by each color or pattern
The scale of the chart
5.
MULTIPLE CHOICE QUESTION
30 sec • 1 pt
How many hot drinks were sold in January according to the example chart?
400
550
450
500
6.
MULTIPLE CHOICE QUESTION
30 sec • 1 pt
How many cold drinks were sold in March?
450
300
750
600
7.
MULTIPLE CHOICE QUESTION
30 sec • 1 pt
In which two months were the same number of hot drinks sold?
None of the above
January and March
February and March
January and February
Access all questions and much more by creating a free account
Create resources
Host any resource
Get auto-graded reports
Continue with Google

Continue with Email
Continue with Classlink
Continue with Clever
or continue with
Microsoft
%20(1).png)
Apple
Others
Already have an account?
Similar Resources on Wayground

3 questions
I WONDER - How Are Smell And Taste Linked?
Interactive video
•
KG - 6th Grade
2 questions
Fourth of July carnival parade in Los Angeles
Interactive video
•
6th - 8th Grade
2 questions
Calculating a Percentage of a Whole Number: Solving 2% of 3,000
Interactive video
•
4th - 6th Grade
7 questions
Lesson 2 - Career Opportunities
Interactive video
•
7th Grade
Popular Resources on Wayground
15 questions
Fractions on a Number Line
Quiz
•
3rd Grade
20 questions
Equivalent Fractions
Quiz
•
3rd Grade
25 questions
Multiplication Facts
Quiz
•
5th Grade
29 questions
Alg. 1 Section 5.1 Coordinate Plane
Quiz
•
9th Grade
22 questions
fractions
Quiz
•
3rd Grade
11 questions
FOREST Effective communication
Lesson
•
KG
20 questions
Main Idea and Details
Quiz
•
5th Grade
20 questions
Context Clues
Quiz
•
6th Grade
Discover more resources for Mathematics
36 questions
6th Grade Math STAAR Review
Quiz
•
6th Grade
14 questions
Volume of rectangular prisms
Quiz
•
7th Grade
20 questions
Graphing Inequalities on a Number Line
Quiz
•
6th - 9th Grade
23 questions
Solve and Graph Inequalities
Quiz
•
6th Grade
15 questions
Distributive Property & Review
Quiz
•
6th Grade
10 questions
Mean, Median, Mode, and Range
Quiz
•
7th Grade
17 questions
Area of a parallelogram
Quiz
•
6th Grade
23 questions
Mean median mode and range
Quiz
•
7th Grade