Understanding Stem and Leaf Plots
Interactive Video
•
Mathematics
•
7th - 8th Grade
•
Practice Problem
•
Hard

Thomas White
FREE Resource
Read more
8 questions
Show all answers
1.
MULTIPLE CHOICE QUESTION
30 sec • 1 pt
What are the two types of graphs discussed in this session?
Scatter plot and area chart
Line graph and histogram
Stem and leaf plot and box and whisker graph
Bar graph and pie chart
2.
MULTIPLE CHOICE QUESTION
30 sec • 1 pt
In a stem and leaf plot, what do the 'stem' and 'leaf' represent?
Stem represents hundreds, leaf represents tens
Stem represents tens, leaf represents ones
Stem represents thousands, leaf represents hundreds
Stem represents ones, leaf represents tenths
3.
MULTIPLE CHOICE QUESTION
30 sec • 1 pt
Why is the stem and leaf plot important in statistics?
It is used to calculate percentages
It organizes data from smallest to largest
It helps in adding numbers quickly
It provides a colorful representation of data
4.
MULTIPLE CHOICE QUESTION
30 sec • 1 pt
How do you find the median in a stem and leaf plot?
By adding all numbers and dividing by the total count
By finding the middle value after organizing data
By averaging the first and last values
By selecting the highest and lowest values
5.
MULTIPLE CHOICE QUESTION
30 sec • 1 pt
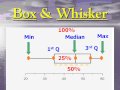
What is the purpose of a box and whisker graph?
To display data distribution in quartiles
To show the frequency of data
To highlight the mean of data
To compare two different data sets
6.
MULTIPLE CHOICE QUESTION
30 sec • 1 pt
Which part of the box and whisker graph represents the median?
The right whisker
The entire box
The left whisker
The line inside the box
7.
MULTIPLE CHOICE QUESTION
30 sec • 1 pt
Why might one whisker be longer than the other in a box and whisker graph?
Because the data is more concentrated
Because the data is more spread out
Because there are more data points
Because the data is skewed
Access all questions and much more by creating a free account
Create resources
Host any resource
Get auto-graded reports
Continue with Google

Continue with Email
Continue with Microsoft
or continue with

%20(1).png)
Apple
Others
Already have an account?
